Gold/Silver – Now is the time to dollar cost average

Gold/Silver – Now is the time to dollar cost average

It was just seventeen days ago (February 1) when Gold went on a two-day rally looking as though it was going to punch back through $2000/oz (Silver $25/oz), and if you were not already on board, you thought you missed it for good. Since then, Gold and other Precious Metals seem to have hit the "pain train" as economic data continues to support an aggressive Fed policy stance leading to a stronger U.S. Dollar and rising Treasury Yields. While the Fed may want to keep its hawkish narrative alive, the reality is that the wheels are already starting to fall off the economy, and no matter what cards they hold up their sleeves, they will ultimately have to pivot dovish to save face.

Even though the Fed aims to stay "apolitical" and is laser-focused on getting back down to a 2% inflation target, the probability of reaching that goal in this new global environment is nil. The heightened geopolitical tensions and unpredictable weather patterns leave basic commodity prices at elevated levels that are here to stay. Those rising input costs will ultimately lift the prices of all goods and services, and those costs will drive the consumer to take on more debt. The rising borrowing costs will spear the economy into a recession where political leaders will pressure the Fed into reversing policy action. That is why I believe getting on board assets like Gold and Silver on this decline makes sense to "dollar cost average" to try and take advantage of the recent declines.

Daily Silver Chart

Since their October 2022 lows, Gold and Silver saw substantial gains, which peaked in January. The short-term traders and investors involved in those markets then began liquidating those holdings and going back to chasing "profitless tech and cryptocurrencies." Now that those asset classes have once again peaked, a rotation back into hard assets will become underway in anticipation of a "Fed pivot." I anticipate this occurrence happening in the second quarter. To further help you develop a trading plan, I went back through 20 years of my trading strategies to create a Free New "5-Step Technical Analysis Guide to Gold that can easily apply to Silver." The guide will provide you with all the Technical analysis steps to create an actionable plan used as a foundation for entering and exiting the market. You can request yours here: 5-Step Technical Analysis Guide to Silver.
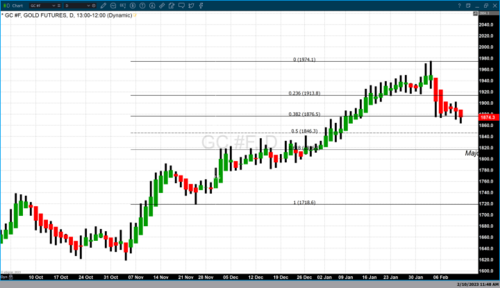
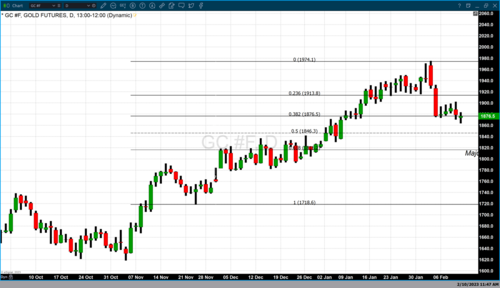
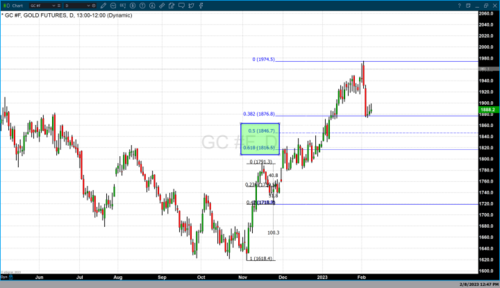
Daily Gold Cha

Strategy

By systematically purchasing regular intervals of the 10-ounce Gold contract or 1000-ounce Silver contract, you can layer in over time and preposition for the next rally. One example with a $25,000 account size would be to focus on the December 2023 10-ounce Gold contract and use a dollar-cost average approach by purchasing 10 ounces of Gold at 1850/oz, 10 oz at 1800, and 10 oz at 1750 with a year-end target of $2100/oz. If filled on all three contracts, your average price will be $1800/oz; therefore, every dollar move Gold makes on the three contracts will be $30 since you control 30 ounces. If the $2100/oz price objective is achieved by year-end, this will result in a gain of approximately $9,000 (30 oz times $300 rise). Traders should also consider proper risk management while using a dollar-cost averaging approach, such as a hard stop on three contracts at $1700. If that were to occur under this scenario, it would likely result in a loss of $3,000. If you have never traded futures or commodities or would like to learn more about taking delivery of Silver, I just completed a new educational guide that answers all your questions on transferring your current investing skills into trading "real assets," such as the 1000 oz Silver futures contract. You can request yours here: Trade Metals, Transition your Experience Book.

By Phillip Streible

Contributing to kitco.com

Time to Buy Gold and Silver

David

Central banks are replacing dollars with gold

Central banks are replacing dollars with gold
 

The economy started the year on a strong note, and the gold market is taking a hit. The Federal Reserve might need to raise rates more than expected since inflation is not coming down fast enough.

Here's a look at Kitco's top 3 stories of the week:

3. Macro data: Gold price drops below $1,850 as U.S. retail sales surprise on the upside in January

2. Frank Giustra warns that the dollar will be dethroned in 'bifurcated' global monetary system

1. Billionaire John Paulson: central banks are replacing dollars with gold, you are better off investing in precious metal than USD

By Anna Golubova

For Kitco News

Time to Buy Gold and Silver

David

Gold market cautious as investors spooked by risk of Fed hiking 50 bps in March

Gold market cautious as investors spooked by risk of Fed hiking 50 bps in March

Gold is down for the fourth week in a row as markets are worried about how aggressive the Federal Reserve will have to be to bring inflation down to 2%.

Markets were hit with stronger-than-expected economic data and stubborn inflation numbers this week.

In response, gold struggled, with April Comex gold futures down 1.3% on the week and last at $1,851 an ounce.

"Inflation will be more sticky than many anticipated. And we got confirmation that economic data is firm," TD Securities global head of commodity strategy Bart Melek told Kitco News. "The next Fed move could be 50 basis points. And the central bank might not be able to stop there. And that means higher rates for longer."

The problem for gold is that the U.S. dollar has been climbing. "The hypothesis that the U.S. dollar will weaken in a big hurry is being questioned," Melek said.

For those playing the long game, OANDA senior market analyst Edward Moya told Kitco News that there are two drivers to keep an eye on.

The first is the new expectations for additional Fed tightening. "The Fed is clearly going to remain aggressive in tightening. The 50 bps startled a lot of traders," Moya said. "Even though half a point rate increase might not play out, the Fed will be hiking in March, May, and probably in June."

The CME FedWatch Tool currently sees an 18% chance of a 50 bps hike in March.

The second thing to watch is recession risks, which will start climbing as the Fed continues to raise rates. "It seems we are recession bound. This is an economy that will need a recession to bring down inflation. And markets will start to believe that," Moya noted.

And all the recession talk is good for gold, he added.


Gold price levels to watch

Analysts remain largely neutral on gold in the short-term as they see the $1,800 an ounce level as likely holding. "I don't think $1,800 will break. That is a huge support level," Moya said.

Next week, analysts will look at FOMC minutes from the February meeting, PMI data, the Fed's preferred inflation measure – core PCE, and more Fed speakers.

Longer-term, Melek is optimistic that the precious metal could still hit $2,000 an ounce towards the end of the year or in early 2024.

"The market will react to the actual pivot happening. The question is whether it will be later in 2023 or early 2024," Melek said. "As the economy slows, the Fed will decide that slower economic activity will do more harm than bringing inflation down to 2%."


Data next week

Tuesday: U.S. existing home sales, manufacturing PMI

Wednesday: FOMC February meeting minutes, FOMC member Williams speaks

Thursday: U.S. GDP Q4, U.S. jobless claims

Friday: U.S. PCE price index, U.S. new home sales

By Anna Golubova

For Kitco News

Time to Buy Gold and Silver

David

Gold rallies as bulls brush off hot U.S. inflation report

Gold rallies as bulls brush off hot U.S. inflation report

Gold prices are moderately up and silver slightly higher in midday U.S. trading Thursday, in the aftermath of a U.S. inflation report that came in hot. Gold and silver traders may reckon that recent sell offs have already factored into the metals’ prices the fact the Federal Reserve will have to remain hawkish for longer on U.S. monetary policy. April gold was up $6.50 at $1,851.70 and March silver was up $0.118 at $21.69.

Today’s U.S. producer price index report for January came in at up 0.7% month-on-month, which was well above the PPI forecast of up 0.4% from December, following a decline of 0.5% in December from November. The hotter PPI report falls into the camp of the U.S. monetary policy hawks, who want to see the Fed continue to raise U.S. interest rates to choke off problematic price inflation.

Global stock markets were mostly higher. U.S. stock indexes are pointed toward lower openings when the New York day session begins. The fact the U.S. dollar index could not rally on today’s hot PPI number also suggests the market place has dialed in the Fed’s future intentions on keeping interest rates higher for longer.

 Frank Giustra warns that the dollar will be dethroned in 'bifurcated' global monetary system, CBDCs and AI could usher in a 'terrifying' world with mass joblessness and digital 'control'

The key outside markets see the U.S. dollar index a bit weaker on a corrective pullback from recent good gains that saw the index hit a five-week high Wednesday. Nymex crude oil futures prices are slightly up and trading around $78.75 a barrel. The yield on the benchmark U.S. 10-year Treasury note is presently fetching 3.836%.

Technically, April gold futures prices hit a six-week low early on today. Bulls have the very slight overall near-term technical advantage. A fledgling downtrend is in place on the daily chart. Bulls’ next upside price objective is to produce a close above solid resistance at $1,900.00. Bears' next near-term downside price objective is pushing futures prices below solid technical support at $1,800.00. First resistance is seen at Wednesday’s high of $1,870.90 and then at this week’s high of $1,881.60. First support is seen at today’s low of $1,836.60 and then at $1,825.00. Wyckoff's Market Rating: 5.5

March silver futures were prices Wednesday hit a 2.5-month low. The silver bears have the slight overall near-term technical advantage. Silver bulls' next upside price objective is closing prices above solid technical resistance at $23.00. The next downside price objective for the bears is closing prices below solid support at $21.00. First resistance is seen at Wednesday’s high of $21.875 and then at this week’s high of $22.085. Next support is seen at this week’s low of $21.385 and then at $21.00. Wyckoff's Market Rating: 4.5.

March N.Y. copper closed up 1,205 points at 413.05 cents today. Prices closed near the session high on short covering after hitting a five-week low on Wednesday. The copper bulls have the overall near-term technical advantage. A fledgling price downtrend on the daily bar chart was negated today. Copper bulls' next upside price objective is pushing and closing prices above solid technical resistance at the January high of 435.50 cents. The next downside price objective for the bears is closing prices below solid technical support at 380.00 cents. First resistance is seen at 420.00 cents and then at 425.00 cents. First support is seen at 405.00 cents and then at 400.00 cents. Wyckoff's Market Rating: 6.5.

By Jim Wyckoff

For Kitco News

Time to Buy Gold and Silver

David

Hawkish Fed forward guidance pressure gold lower

Hawkish Fed forward guidance pressure gold lower

Gold continues to trade under pressure moving to lower prices after yesterday’s CPI report for January indicated that inflation declined to 6.4% year-over-year. January’s CPI report came in lower by 6.4% year-over-year, than the prior month of December. However, analysts were expecting a larger decline with expectations that yesterday’s report would come in between 6.2% and 6.3%. When combined with last week’s unexpected jobs report the collective information will allow the Federal Reserve to maintain its aggressive stance which means more interest rate hikes, and that rates will remain elevated longer.

Chairman Powell has been resolute in his commitment to keeping higher rates elevated throughout the entire calendar year. Market participants are beginning to accept the high probability that the Fed will take rates to between 5.1% and 5.2% and keep them elevated with no rate cuts in 2023.

Bullish factors are outweighed by immediate concerns about inflation and rate hikes

While gold has traded under pressure there are bullish undertones that at some point could come into play. The dollar has been gaining strength when compared to other currencies, but for Americans, the dollar's purchasing power continues to be diminished, a byproduct of higher levels of inflation. The national debt continues to grow and the United States has reached its debt limit which means that the government will have to raise the debt ceiling which means that the United States will grow its national debt to a higher level.

Gold futures basis the most active April 2023 contract is currently down $18.80 or 1.01% and fixed at $1846.60. Dollar strength was responsible for a little over half of today’s decline with the dollar gaining 63 points (+0.61%) and the dollar index is currently fixed at 103.76.

Another factor pressuring gold lower is that recent data has suggested that the Federal Reserve could modify its current rate target of 5.1% to closer to 6% to accelerate the process of reducing inflation.

Gold intrinsically benefits from higher levels of inflation and higher interest rates are detrimental. This is because gold does not generate a yield which makes US treasuries and other interest-bearing assets more favorable.

Although this is a headline-driven market and current headlines have had a hard impact that took gold prices lower technical indicators will come into play at the point in which investors believe that gold is becoming oversold and more valuable than current pricing.

Our technical studies indicate that it is highly probable that gold will trade to $1815 before finding technical support. This is based upon a Fibonacci retracement of 61.8%. The data set used for this retracement begins at $1719 and concludes at $1980.

By Gary Wagner

Contributing to kitco.com

Time to Buy Gold and Silver

David

BLS releases headline CPI inflation report today for January 2023

BLS releases headline CPI inflation report today for January 2023

Traders and investors have been patiently waiting for today’s inflation report to glean information on whether or not the Fed will maintain its current monetary policy or adjust it to a somewhat looser policy. The report came in very close to estimates and did indicate that inflation is continuing to diminish. However, the increase in headline inflation at 0.5% was the biggest month-to-month increase since June 2022.

The report indicated that headline inflation (including energy and food costs) declined for the seventh straight month. January’s numbers came in at 6.4% year-over-year which is a month-over-month increase of 0.5%.

I believe the biggest takeaway from today’s report was that when combined with the last jobs report that was exceedingly robust it gives the Federal Reserve the ammunition to continue its aggressive monetary stance because today’s report and the jobs report last week indicate that the strength of the economy is such that it can handle recent rate hikes by the Federal Reserve.

Some analysts including myself believe that soon inflation reduction will become more difficult than it has been in the past. Those analysts are anticipating that at some point inflationary pressures will become more persistent and harder to tame. Another issue is that the Federal Reserve cannot alone solve the problem because the administration is the political body that sets the budget and continues to increase the national debt by spending more than before and most importantly increasing the national debt.

Another takeaway from today’s report is that it is highly probable that the Federal Reserve will raise rates again in March. According to the CME’s FedWatch, the probability of a ¼% rate hike at the next FOMC meeting is 90%. If there is any sunshine or bright news to today’s report it is that I believe that it will be highly likely that the Federal Reserve will raise rates by ¼% next month but then pause because there is an intrinsic time lag between a rate hike and seeing how that affects the economic contraction that is the goal of the Federal Reserve to reduce inflation.

pic

Gold futures basis the most active April contract is currently trading at $1.30 higher and fixed at $1864.80. Dollar neutrality neither helped nor hindered today’s move in gold. But the fractional upside move indicates that today’s report has not dramatically changed market sentiment for gold and most likely will not be the single factor that results in a key reversal from the bearish market sentiment currently to bullish market sentiment.

My last concern is the fact that the revision for the December inflation report revealed a different picture and outlook and that raises the question as to whether or not the numbers released today are going to have a similar revision further down the road.

By Gary Wagner

Contributing to kitco.com

Time to Buy Gold and Silver

David

Gold, silver down on position evening ahead of U.S. CPI

Gold, silver down on position evening ahead of U.S. CPI

Gold and silver prices are lower in midday U.S. trading Monday, with silver hitting a 2.5-month low and gold a five-week bottom. The near-term chart postures for both metals have deteriorated recently, which are prompting some technical selling pressure. Also, weak long liquidation in the gold and silver futures markets is likely featured today, ahead of a key U.S. inflation report Tuesday. April gold was last down $10.40 at $1,864.00 and March silver was down $0.175 at $21.90.

Traders and investors are awaiting the U.S. economic data point of the week on Tuesday morning–the consumer price index report for January. The CPI is seen up 6.2%, year-on-year, compared to the rise of 6.5% in the December report. On Thursday, the U.S. producer price index report is released. The expected CPI number is still hot—even if it is down from previous CPI reports–and a print that comes in close to it may still keep the Federal Reserve in a monetary-policy-tightening mode for the next few months. That’s likely in part why gold and silver bulls are mostly standing on the sidelines today.

Global stock markets were mixed overnight, with European shares mostly higher and Asian shares mostly lower. U.S. stock indexes are higher at midday.

 Gold price is going to $2,200 as central banks break the global economy – Degussa's Thorsten Polleit

The key outside markets see the U.S. dollar index slightly firmer. Nymex crude oil futures prices are near steady and trading around $79.50 a barrel. The yield on the benchmark U.S. 10-year Treasury note is presently fetching 3.724%.

There was no major U.S. economic data released Monday.

Technically, April gold futures prices hit a five-week low today. Bulls still have the slight overall near-term technical advantage. However, they continue to fade. Bulls’ next upside price objective is to produce a close above solid resistance at the February high of $1,975.20. Bears' next near-term downside price objective is pushing futures prices below solid technical support at $1,800.00. First resistance is seen at today’s high of $1,877.20 and then at $1,885.00. First support is seen at $1,850.00 and then at $1,835.00. Wyckoff's Market Rating: 5.5

March silver futures prices hit a 2.5-month low today. The silver bulls and bears are on a level overall near-term technical playing field but bears have some momentum on their side. Silver bulls' next upside price objective is closing prices above solid technical resistance at $23.00. The next downside price objective for the bears is closing prices below solid support at $21.00. First resistance is seen at $22.25 and then at last week’s high of $22.635. Next support is seen at $21.50 and then at $21.00. Wyckoff's Market Rating: 5.0.

March N.Y. copper closed up 360 points at 405.35 cents today. Prices closed near the session high. The copper bulls have the overall near-term technical advantage. However, a fledgling price downtrend is in place on the daily bar chart. Copper bulls' next upside price objective is pushing and closing prices above solid technical resistance at the January high of 435.50 cents. The next downside price objective for the bears is closing prices below solid technical support at 380.00 cents. First resistance is seen at last week’s high of 412.05 cents and then at 417.50 cents. First support is seen at the February low of low of $3.9930 and then at 395.00 cents. Wyckoff's Market Rating: 6.0.

By Jim Wyckoff

For Kitco News

Time to Buy Gold and Silver

David

U.S. fighter jet shoots down UFO over Canada, Trudeau says

U.S. fighter jet shoots down UFO over Canada, Trudeau says

WASHINGTON/OTTAWA, Feb 11 (Reuters) – A U.S. F-22 fighter jet shot down an unidentified object over Canada on Saturday, the second such shootdown in as many days, as North America appeared on heightened alert following a week-long Chinese spying balloon saga that drew the global spotlight.

Canadian Prime Minister Justin Trudeau announced the shootdown on Twitter and said it took place over the Yukon territory in the country's north. He said Canadian forces would recover and analyze the wreckage from the object.

Trudeau also said he had spoken with U.S. President Joe Biden about the incident, a day after Biden ordered a shootdown of an unidentified flying object over sea ice near Deadhorse, Alaska. The U.S. military on Saturday was still tight-lipped about what, if anything, it had learned as recovery efforts were underway.

The Pentagon on Friday offered only a few details, including that the object was the size of a small car, it was flying at about 40,000 feet and could not maneuver and appeared to be unmanned. U.S. pilots and intelligence officials have been trying to learn about the object since it was first spotted on Thursday.

"We have no further details at this time about the object, including its capabilities, purpose, or origin," Northern Command said on Saturday.

It noted difficult arctic weather conditions, including wind chill, snow, and limited daylight that hinder search and recovery efforts.

"Personnel will adjust recovery operations to maintain safety," Northern Command said.

On Feb. 4, a U.S. F-22 fighter jet brought down what the U.S. government called a Chinese surveillance balloon off the coast of South Carolina following its week-long journey across the United States and portions of Canada. China's government has said it was a civilian research vessel.

Some U.S. lawmakers criticized Biden for not shooting down the Chinese balloon sooner. The U.S. military had recommended waiting until it was over the ocean out of fear of injuries from falling debris.

Time to Buy Gold and Silver

David

This is the next big catalyst for gold price

This is the next big catalyst for gold price

Gold is looking at its third consecutive week of losses after January's rally, which saw its best start to the year in over a decade. And now all eyes shift to next week's U.S. inflation report, with analysts saying it could be the next big catalyst for the precious metal.

After surging to $1,975 an ounce last week, April Comex gold futures are now trading at $1,870.70 an ounce, down 5.3% from that peak.

"The dollar is reverting, and the Fed remains hawkish, which is weighing on gold," RJO Futures senior market strategist Frank Cholly told Kitco News.

Gold's bullish sentiment began to change after a strong employment report out of the U.S. last week showed job gains of 517,000 in January.

This was followed by Federal Reserve Chair Jerome Powell confirming markets' worries that if the U.S. economy continues to surprise on the upside, the central bank would be forced to raise rates higher than anticipated.

Powell brought out just the right amount of "Fed speak" when he appeared at the Economic Club of Washington, D.C., Tuesday. On the one hand, he reiterated that the "disinflation process" has begun. On the other hand, he warned that if data continue to come in stronger, the Fed will move peak rates higher.

"It really fits well with the definition of what we often call Fed speak, which is a strategy by the chairman of the Fed to speak out of both sides of their mouth so that the markets get both signals," Gainesville Coins precious metals expert Everett Millman told Kitco News. "The hope is that things remain steady and both sides have something to latch to. That's exactly what Powell did. The most likely outcome here is that the Fed continues along its rate hike path until the economy falters."

What to watch with the CPI report

Next week, the gold market is gearing up for a number of key macro releases. Tuesday's CPI report is the one to watch as it could be the next big catalyst for the precious metals space, TD Securities senior commodity strategist Daniel Ghali told Kitco News.

"We need a substantial catalyst for subsequent selling activity to ensue in gold. It could come in the form of next week's CPI data. At the same time, if the CPI won't be a big enough shock, gold won't see a lot of selling activity into next week," Ghali described.

Even if the CPI report continues to show slowing inflation, the Fed won't be ready to take its foot off the gas yet, said Cholly. "Gold has a little more downside," he said.

Market consensus calls are projecting annual inflation to slow to 6.2% in January from December's 6.5%.

"We think that inflation will fall by more than the consensus, which should give a lift to commodity prices as it will allay fears of a more hawkish Fed and higher U.S. interest rates for longer," said analysts at Capital Economics.

Ghali also pointed out that a large cohort of investors still sees gold as overvalued, but it is unclear who would be willing to sell based on the flow perspective.

The recent central bank gold buying has supported gold, and the market is waiting to see if that trend will continue.

The participants that have driven the gold rally above $1,800 have been central banks and short-covering, Ghali said. "If that trend continues, then I would feel more comfortable with gold holding above $1,800," he noted.

The World Gold Council amended its Gold Demand Trends report this week, stating that central bank gold buying was at a record high in 2022, with 1,136 tonnes purchased.

Gold price levels

Gold's potential trading range is pretty wide at the moment, with strong support currently at $1,800 an ounce and resistance at $1,900, Ghali noted.

Cholly is looking at the $1,850-$1,855 range. "Moving averages are important. We are sitting at a 50-day right now. And the 200-day is at $1,812. Somewhere between these two marks, there is market equilibrium. Gold will consolidate and recover from those levels," he said.

Key data next week

Other data to keep an eye on include U.S. retail sales, the Producer Price Index, and industrial production.

"January activity data is going to be strong throughout. The contrast between the weather in mid-late December, where it was incredibly cold, versus a very mild January, couldn't be more stark," said ING chief international economist James Knightley. "This means there will be delayed consumption, plus better weather means more people out and about, which in all likelihood will lift January spending. We already know auto sales were very strong and that will lift retail sales mightily on its own."

Tuesday: U.S. CPI

Wednesday: U.S. retail sales, N.Y. Empire State manufacturing index, U.S. industrial production

Thursday: U.S. PPI, U.S. jobless claims, U.S. housing starts and building permits, Philly Fed manufacturing index

By Anna Golubova

For Kitco News

Time to Buy Gold and Silver

David

Investors wait for CPI numbers but the bearish sentiment remains on Fed’s narrative

Investors wait for CPI numbers but the bearish sentiment remains on Fed’s narrative

Gold investors had a wake-up call last Thursday when gold futures hit $1974, the highest value of 2023. But that same day also marked the beginning of a correction. Gold would lose approximately $90 per ounce over last Thursday and Friday.

This week started with a whimper with gold trading to a higher high and higher low on Monday, Tuesday, and Wednesday. However, each day had fractional gains and through the eyes of a Japanese candlestick chart were identified as spinning tops which always have a small real body (the rectangle drawn between the open and closing price of a trading session). While gold prices did have gains it was obvious that this strength was tepid at best.

On a technical basis, gold was attempting to find support at the 38.2% Fibonacci retracement level which is considered an acceptable but shallow correction. The caveat though is that gold as well as the financial markets at large have been headline driven based on the latest comments of Federal Reserve officials.

In December the Federal Reserve released its most current economic projections and “dot plot” which contained the anticipated rate changes by the Federal Reserve as 17 Federal Reserve members placed their opinion (as a dot). December's projections of interest rates in 2023 contained the stark realization that unanimously voting members of the Federal Reserve anticipated taking the current benchmark rate higher with the goal of just over 5% and maintaining those elevated rates throughout the entire calendar year of 2023.

The elevated hawkish tone reflecting expected actions by the Federal Reserve began to factor into the current pricing of precious metals, US treasuries, and stocks. A faction of market participants continues to believe that there would be rate cuts this year contrary to what the Federal Reserve’s narrative was and continues to be. However last week’s announcement by the Federal Reserve was that they might have to take rates to a higher target closer to 6%. This most likely is what prompted the selloff at the end of last week.


Thursday was the only day this week in which gold prices closed below the opening value and today’s action resulted in a fractional decline of roughly $3.30. As of 4:45 PM EST, the most active April futures contract is currently fixed at $1875. Silver also has been trading under pressure for the better part of this week with the most active March contract attempting to hold pricing at $22 per ounce. Currently, March silver futures are fixed at $22.01 after factoring in today’s decline of just over $0.12 per ounce.

Dollar strength was certainly a strong component providing moderate to strong headwinds as dollar strength characterized today’s action. The dollar index gained 0.37% in trading and is currently fixed at 103.49.

Investors are waiting for the next report on headline inflation vis-à-vis the CPI next Tuesday. They are hoping to gain better insight into possible pivots by the Federal Reserve concerning their rate hikes. The most important takeaway of price action over the last few weeks has less to do with any technical indicators and more to do with the event-driven news based on the current narrative of the Federal Reserve.

By Gary Wagner

Contributing to kitco.com

Time to Buy Gold and Silver

David