Slightly cooler U.S. inflation report boosts gold, silver

Slightly cooler U.S. inflation report boosts gold, silver

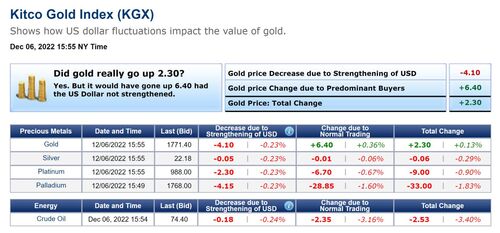
Gold and silver prices are solidly higher in midday U.S. trading Tuesday, but down from daily highs, following a slightly tamer-than-expected U.S. inflation report. Gold surged to a five-month high and silver a seven-month high right after the report’s release. February gold was last up $26.70 at $1,818.90 and March silver was up $0.407 at $23.81.

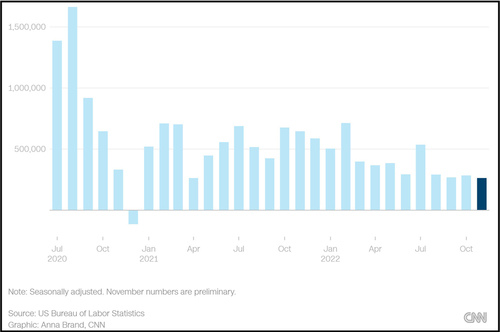
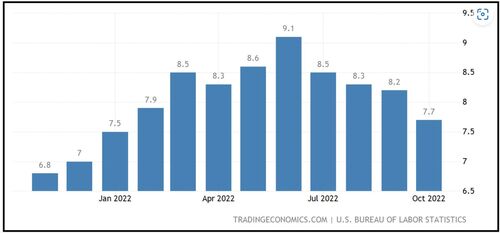
The U.S. consumer price index report for November showed a rise of 0.1% from October and was up 7.1%, year-on-year. CPI was forecast to come in up 0.3% from October and up 7.3%, year-on-year. The slightly cooler-than-expected inflation data was enough to rally the stock and financial markets, and the metals, while tanking the U.S. dollar index. The CPI report lands in the camp of the U.S. monetary policy doves, who want to see the Federal Reserve back off the accelerator on its aggressive monetary policy tightening path.

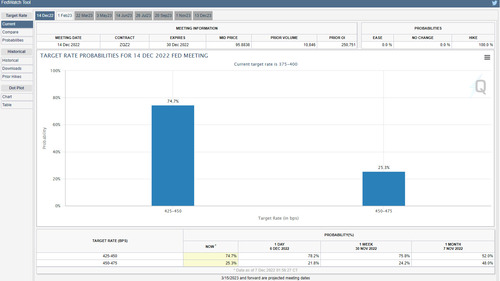
U.S. stock indexes are mixed at midday and have lost early strong gains in the aftermath of the CPI report. After the initial euphoria from the CPI report, traders and investors realized the Federal Reserve still has some tightening of monetary policy in their sights. The Fed’s Open Market Committee (FOMC) meeting began Tuesday morning and ends Wednesday afternoon with a statement and press conference from Fed Chair Powell. The FOMC is very likely to raise U.S. interest rates by 0.5%. The European Central Bank and the Bank of England meet on Thursday and are likely to follow the U.S. Federal Reserve with half-point rate hikes.

 Deutsche Bank wants back in the gold market after eight-year absence

The key outside markets today see the U.S. dollar index sharply down and hitting a 5.5-month low. Nymex crude oil prices are sharply higher and trading around $75.85 a barrel. A major oil pipeline in the U.S. has been shut due to a leak, and that’s supporting Nymex crude oil prices this week. Meantime, the yield on the benchmark U.S. 10-year Treasury note is presently 3.492% and fell after the cooler CPI report.

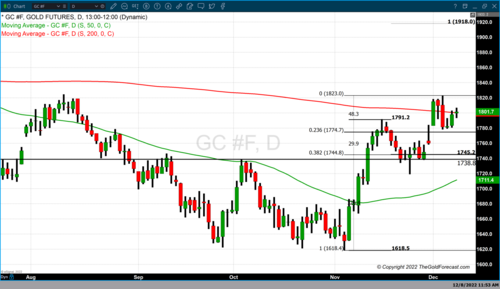
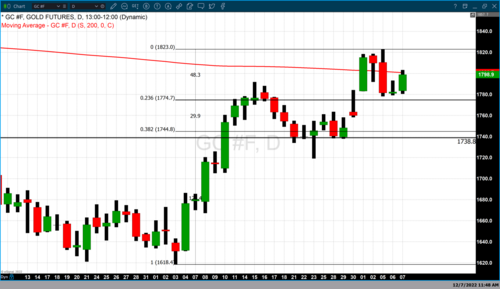
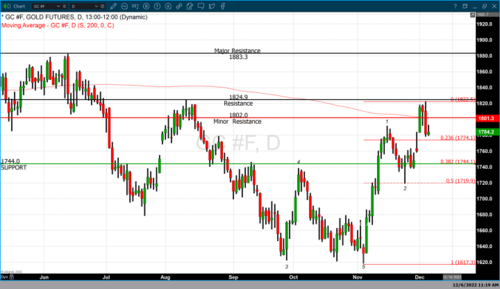
Technically, February gold futures prices hit a five-month high today. The gold futures bulls have the firm overall near-term technical advantage. Prices are in a five-week-old uptrend on the daily bar chart. Bulls’ next upside price objective is to produce a close above solid resistance at $1,900.00. Bears' next near-term downside price objective is pushing futures prices below solid technical support at $1,775.00. First resistance is seen at $1,822.90 and then at today’s high of $1,836.90. First support is seen at $1,800.00 and then at this week’s low of $1,789.00. Wyckoff's Market Rating: 7.0

March silver futures prices hit a seven-month high today. The silver bulls have the firm overall near-term technical advantage. Prices are in a choppy 3.5-month-old uptrend on the daily bar chart. Silver bulls' next upside price objective is closing prices above solid technical resistance at $25.00. The next downside price objective for the bears is closing prices below solid support at $22.00. First resistance is seen at today’s high of $24.39 and then at $25.00. Next support is seen at this week’s low of $23.32 and then at $23.00. Wyckoff's Market Rating: 7.0.

March N.Y. copper closed up 425 points at 364.25 cents today. Prices closed nearer the session low today. The copper bulls have the overall near-term technical advantage. Copper bulls' next upside price objective is pushing and closing prices above solid technical resistance at 400.00 cents. The next downside price objective for the bears is closing prices below solid technical support at 354.70 cents. First resistance is seen at today’s high of 392.90 cents and then at the November high of 394.70 cents. First support is seen at this week’s low of 378.60 cents and then at 370.00 cents. Wyckoff's Market Rating: 6.0.

By Jim Wyckoff

For Kitco News

Time to Buy Gold and Silver

David

Gold, silver see routine profit taking

Gold, silver see routine profit taking

Gold and silver prices are solidly lower in midday U.S. trading Monday. Normal corrective pullbacks and some profit taking by the shorter-term futures traders were featured to start the trading week, following recent good price gains for both metals. A firmer U.S. dollar index on this day also worked against the metals market bulls. February gold was last down $17.70 at $1,792.90 and March silver was down $0.287 at $23.435.

Traders await a major U.S. data point on Tuesday–the consumer price index report for November, out at 8:30 a.m. EST. The CPI is seen coming in up 7.3%, year-on-year.

Major central banks will this week complete the most aggressive year for interest-rate hikes in four decades with their fight against inflation still not over even as their economies slow. The Federal Reserve’s Open Market Committee (FOMC) meeting begins Tuesday morning and ends Wednesday afternoon with a statement and press conference from Fed Chair Powell. The FOMC is mostly likely to raise U.S. interest rates by 0.5%. Then, the European Central Bank and the Bank of England meet on Thursday and are likely to follow the U.S. Federal Reserve with half-point rate hikes.

 Outlook 2023 LIVE with Gareth Soloway

The key outside markets today see the U.S. dollar index modestly up. Nymex crude oil prices are higher and trading around $72.75 a barrel. Prices last Friday hit an 11-month low. Meantime, the yield on the benchmark U.S. 10-year Treasury note is presently 3.593%.

Technically, February gold futures bulls still have the overall near-term technical advantage. Prices are in a five-week-old uptrend on the daily bar chart. Bulls’ next upside price objective is to produce a close above solid resistance at the December high of $1,822.90. Bears' next near-term downside price objective is pushing futures prices below solid technical support at $1,750.00. First resistance is seen at $1,800.00 and then at today’s high of $1,809.30. First support is seen at last week’s low of $1,778.10 and then at $1,770.00. Wyckoff's Market Rating: 6.0

March silver futures bulls have the overall near-term technical advantage. Prices are in a choppy 3.5-month-old uptrend on the daily bar chart. Silver bulls' next upside price objective is closing prices above solid technical resistance at $25.00. The next downside price objective for the bears is closing prices below solid support at $22.00. First resistance is seen at the December high of $23.90 and then at $24.00. Next support is seen at $23.00 and then at $22.50. Wyckoff's Market Rating: 6.5.

March N.Y. copper closed down 830 points at 379.55 cents today. Prices closed nearer the session low today. The copper bulls have the overall near-term technical advantage. Copper bulls' next upside price objective is pushing and closing prices above solid technical resistance at 400.00 cents. The next downside price objective for the bears is closing prices below solid technical support at 354.70 cents. First resistance is seen at today’s high of 385.95 cents and then at 390.00 cents. First support is seen at last week’s low of 377.30 cents and then at 370.00 cents. Wyckoff's Market Rating: 6.0.

By Jim Wyckoff

For Kitco News

Time to Buy Gold and Silver

David

Hawkish Fed surprise could knock down gold price next week

Hawkish Fed surprise could knock down gold price next week

Even though gold is looking to end the week above $1,800 an ounce, there is a high chance for a move lower as the Federal Reserve can still surprise on the hawkish side, according to analysts.

Despite the rally, the precious metal is trading essentially flat on the week, with February Comex gold futures last at $1,815 an ounce.

All eyes are now on the November inflation figure after the Producer Price Index (PPI) rose more than expected.

The CPI print is scheduled to be released on Tuesday, with analysts warning that inflation will likely remain elevated and be slow to decelerate.

"Next week, the CPI is anticipated to trend in the right direction, but it won't come down as quickly as many anticipate. I'm partially bearish on gold next week," OANDA senior market analyst Edward Moya told Kitco News. "Post-Fed, gold could be reeling but then eventually settling higher. Looking at a potential downside for next week, but that will be short-lived."

What to expect from the Fed

The Fed will announce another rate hike on Wednesday, with markets looking for a slower tightening pace of 50 bps versus 75 bps. But a slower pace does not necessarily mean the U.S. central bank is pivoting away from its plan. Fed Chair Jerome Powell has already warned that rates might have to stay higher for longer.

Investors will be paying close attention to the updated dot plot, economic projections, and the language Powell uses during the press conference.

"The new dot plot and new economic forecasts are risk factors for gold. Message from Powell and other Fed speakers has been that the pace of hikes may slow, but we may still see a terminal rate that is somewhat higher," TD Securities commodity strategist Daniel Ghali told Kitco News.

Ghali added that gold has been benefiting from a short-covering rally that is now close to its end. "We've seen a substantial amount of short-covering, which contributed to the rise in gold prices. As the year draws to a close, money managers are reluctant to put on a substantial amount of risk on the table. From this point on, most short covering is now in the rearview, and prices are still at risk of a more hawkish Fed on the horizon," he noted.

How investors interpret the Fed's messaging will also be important, Moya explained. "It will be interesting to see how investors feel about the Fed. Will this be the last hike followed by a pause? You could still make a case that they could go another 50 bps in February. And then, in March, it would be a toss-up. It still seems that more tightening is warranted," he said.

Aside from the macro data, geopolitics might start playing a bigger role for gold again as the war in Ukraine could escalate further, Moya warned.

"That is something we need to stay on top of. Risks of the war escalating further are once again circulating. That is going to give gold some safe haven value," he said.

Russian forces stepped up activity on Friday, shelling the entire front line in the Donetsk region of eastern Ukraine. Meanwhile, Russia's President Vladimir Putin accused the West of "exploiting" Ukraine and using its people as "cannon fodder."

Gold price levels to watch

For gold to make another significant move higher, it needs to cross its 200-day moving average at $1,821, RJO Futures senior market strategist Frank Cholly told Kitco News. "The $1,821 level is very critical. If the market can close above it, then I get bullish. Right now, gold is struggling to get above the 200-day moving average. This is also where it topped out last week," he said.

The outlook on where rates will be next year is what will give gold its direction next week, Cholly added, noting that he is keeping a close eye on the U.S. dollar as well.

Ghali said that more buying would come in at the $1,830 an ounce level, while a drop to $1,740 an ounce could trigger a selloff.

Moya sees $1,775 as key support for gold and $1,830 as an upper boundary in the current price range.
 

Data to watch next week

Tuesday: U.S. CPI

Wednesday: Fed rate decision with FOMC economic projections

Thursday: ECB rate decision, Bank of England decision, U.S. retail sales, U.S. jobless claims, N.Y. Empire State manufacturing index, Philly Fed Manufacturing index

By Anna Golubova

For Kitco News

Time to Buy Gold and Silver

David

Russia’s gold reserves a target in U.S. defense spending bill

Russia's gold reserves a target in U.S. defense spending bill

The U.S. continues to target Russia's massive gold reserves in an effort to sanction the country for its nearly year-long invasion of Ukraine.

Thursday, the U.S. House of Representatives passed the annual National Defense Authorization Act, which will boost defense spending to a record $858 billion next year.

However, the spending bill also includes an amendment that makes it difficult for Russia to use its massive horde of gold. The proposed legislation would directly sanction any U.S. entities that transact with or transport gold from Russia's central bank reserves.

The amendment is similar to a bill introduced in March by independent Senator from Main Angus King, Republican Senators John Cornyn of Texas and Bill Hagerty of Tennessee and Democratic Senator from New Hampshire Maggie Hassan.

"Russia's massive gold supply is one of the few remaining assets that Putin can tap to bankroll his country's violent, bloody expansionism," King told CNN in a statement. "By sanctioning these reserves, we can further isolate Russia from the world's economy and increase the difficulty of Putin's increasingly-costly military campaign."

Russia's central bank has the fifth largest gold reserves in the world at 2,298.50 tonnes, currently valued at $133.6 billion.

"Having this national security imperative in a national defense bill is a clear and powerful way to undercut Putin's illegal, amoral acts and make the financial pinch tighter," King added in his statement.

Sentiment in gold evenly split as prices end the week at a four-month high

Russia's gold has been the target of sanction through 2022. In March, just after Russia invaded Ukraine, the London Bullion Market Association suspended six Russian gold and silver refineries from its Good Delivery list, effectively cutting Russia off from the London precious metals market. In June, leaders of the seven largest economies in the world banned imports of Russian gold.

However, some analysts have said that the western sanctions on Russia have had a negligible effect on the gold market. Russia can still sell its gold to China and Middle Eastern nations.

After passing the House, the legislation will now move to the Senate for a vote.

By Neils Christensen

For Kitco News

Time to Buy Gold and Silver

David

Gold trades sideways as investors wait for next week’s FOMC and CPI report

Gold trades sideways as investors wait for next week’s FOMC and CPI report

Unlike yesterday’s double-digit gain in gold prices, today we see gold once again consolidating as it did on Tuesday. Tuesday’s price consolidation in gold indicated that the dramatic decline that occurred on Monday was more akin to a one-and-done scenario than the beginning of a correction. It was the equal or slightly higher low on Tuesday that was just as important as the fractional gains. It indicated solid short-term support for gold futures at around $1780.

Yesterday gold had a respectable price advance recovering roughly half of the decline traders witnessed on Monday. But I believe the key takeaway from the fractional gains on Tuesday and today is that market participants are waiting for the latest information on inflation when the CPI (Consumer Price Index) is released next Tuesday and the Federal Reserve’s last FOMC meeting of the year concludes on the following day.

The most important factor in recent and upcoming price changes in gold is that it has been and will continue to be driven by headlines.

Market participants are by large anticipating that the Federal Reserve will announce a 50-basis point rate hike rather than 75-basis points. According to the CME’s FedWatch tool, there is a 79.4% probability of a 50-BP rate hike, with only a 20.6% probability of a 75-BP rate hike by the Fed next week. This would break the 75-BP rate hike cycle set by the Federal Reserve beginning in June. This means that a rate hike of ½ a percent next week has been largely factored or baked into the pricing.

Gold futures basis the most active February 2023 contract opened in New York at $1799.50 and traded to a high of $1806. As of 4:35 PM EST, the February contract of gold futures is currently fixed at $1801.20 after factoring in today’s net gain of $3.30. This is just above the 200-day MA which is at $1800.20.

Today’s gains in gold pricing were based upon dollar weakness combined with fractional selling pressure in gold. The dollar is currently trading lower by 0.28% and gold futures are currently up 0.18% higher which confirms that today’s price change in gold is a net result of that combination.

By Gary Wagner

Contributing to kitco.com

Time to Buy Gold and Silver

David

Gold breaks above its 200-day moving average then moves back below it

Gold breaks above its 200-day moving average then moves back below it

Gold futures basis the most active February 2023 contract opened in New York at $1783.30 and traded to a high of $1803.20 just above its 200-day moving average which is currently fixed at $1800.70. The price point of this long-term moving average at least for the short term became a technical level of resistance moving gold back below it. As of 4:19 PM EST, the February contract of gold futures is currently fixed at $1798.90 after factoring in today’s net gain of $16.50 or 0.93%.

Today’s double-digit gains came out of a combination of dollar weakness and traders bidding the precious yellow metal higher. Currently, the dollar is down 0.41% with the dollar index fixed at 105.105. Gold’s gain of 0.92% indicates that market participants were not only active buyers but provided just over 50% of the gains realized in gold futures.

That same ratio can be seen in today’s pricing of physical gold. According to the Kitco Gold Index (KGX), spot gold as of 4:23 PM EST was fixed at $1786.70 after factoring in a net gain today of $15.50. Dollar weakness accounted for $6.55 of the $15.50 gain with the rest attributable to buyers bidding gold prices higher by $8.95.

Market participants move gold prices higher today as continued concerns focus on the Federal Reserve’s last FOMC meeting of the year next week and the next inflation report, the CPI. This report will be released during the first day of the two-day FOMC meeting. This will allow the Federal Reserve to see if the fractional decline in inflation reported for October 2022 in November is a continuation of declines in the CPI index after hitting the highest level this year in June when the CPI came in at a scorching 9.1%. From July to October, the CPI has had consecutive declines coming in at 8.5% in July, 8.3% in August, 8.2% in September, and 7.7% in October.

Traders and investors have largely priced in the high likelihood that the Fed will raise rates by 50 basis points, or a ½ %. This will take the current target rate of 375 – 400 basis points to 425 – 450 basis points by the end of the year. According to the CME’s FedWatch tool, there is a 74.7% probability of a 50-basis point rate hike and a 25.3% probability of a 75-basis point rate hike. It is the possibility, although remote, of a fifth consecutive rate hike of 75 basis points that continues to give market participants angst about the upcoming meeting.

Technical levels to watch with gold futures

Our technical studies indicate that the first level of resistance still occurs at $1802 based on gold’s current 200-day moving average. The next level of resistance above that is $1825 based upon the double top that occurred in both August and December.

Minor support first occurs at $1775 which corresponds to the 23.6% Fibonacci retracement. Major support occurs between $1720 the 50% retracement and $1745 the 38.2% Fibonacci retracement level.

By Gary Wagner

Contributing to kitco.com

Time to Buy Gold and Silver

David

Gold consolidates after trading to a double top near $1825 yesterday

Gold consolidates after trading to a double top near $1825 yesterday

Market participants are acutely aware of next week’s FOMC meeting which begins on Tuesday, December 13, and concludes the following day. Following the conclusion of the last FOMC meeting of the year, the Federal Reserve will release a statement which will be followed by Chairman Powell’s press conference. It is highly anticipated that the Federal Reserve will raise its benchmark Fed funds rate as it has at every consecutive FOMC meeting since March.

Traders and investors have largely priced in the high likelihood that the Fed will raise rates by 50 basis points, or a ½ %. This will take the current target rate of 375 – 400 basis points to 425 – 450 basis points by the end of the year. According to the CME’s FedWatch tool, there is a 77% probability of a 50-basis point rate hike and a 23% probability of a 75-basis point rate hike. It is the possibility, although remote, of a fifth consecutive rate hike of 75 basis points that has given market participants angst about the upcoming meeting.

Gold had fractional gains with the most active February 2023 Comex contract gaining $2.30 or 0.13%. As of 4:55 PM, EST gold futures are fixed at $1783.80. Gold futures opened today at $1780.80 and traded to a high of $1793.20, and a low of $1779.10. The dollar gained 0.26% in trading today with the dollar index currently fixed at 105.515. This means that traders were able to bid gold prices higher while overcoming mild dollar strength.

This can also be seen in the pricing of physical gold today. According to the Kitco Gold Index spot gold is currently fixed at $1771.40. Traders bid physical gold higher by $6.40 and dollar strength took away $4.10 of that gain which resulted in today’s net gain of $2.30.

Today’s fractional gain in gold indicates that market participants have paused the selling pressure seen in yesterday’s technical selling that moved gold prices sharply lower.

Important technical levels in gold futures

Our technical studies indicate that the first level of resistance occurs at $1802 based on gold’s current 200-day moving average. The next level of resistance above that is $1825 based upon the top that occurred in August. Major resistance can be seen at $1883; this is based upon the top that occurred in mid-June.

Minor support first occurs at $1775 which corresponds to the 23.6% Fibonacci retracement. Major support occurs between $1720 the 50% retracement and $1745 the 38.2% Fibonacci retracement level.

By Gary Wagner

Contributing to kitco.com

Time to Buy Gold and Silver

David

Gold, silver hit hard by profit taking, bearish outside markets

Gold, silver hit hard by profit taking, bearish outside markets

Gold and silver prices are sharply lower in midday U.S. trading Monday after hitting multi-month highs overnight. The metals are being hit by heavy profit taking from the shorter-term futures traders and by bearish outside markets. The U.S. dollar index is solidly higher and crude oil prices are lower and lost good early gains. Rising U.S. Treasury yields are also a bearish element for the precious metals markets today. February gold was last down $24.10 at $1,785.20 and March silver was down $0.88 at $22.375.

Today's report on the U.S. ISM services index unexpectedly improved in November, and with only a slight decrease in prices paid. The data may suggest wage pressures will remain stronger. The headline index for November came in at 56.6, which was higher than the expected reading of 53.3. The employment component also moved back to expansion territory. The report falls into the hawkish camp on Federal Reserve monetary policy and helped pressure the stock market, and in turn supported the U.S. dollar index while lifting U.S. bond yields.

Global stock markets were mixed to firmer overnight. U.S. stock indexes are sharply lower near midday, but are still no too far below last week's multi-month highs.

JPMorgan, HSBC to share custody of GLD's 900 tonnes of gold

The key outside markets today see the U.S. dollar index solidly higher after hitting a 3.5-month low last Friday. Nymex crude oil prices are lower and trading around $79.00 a barrel. As of Monday, the European Union and the U.K. have barred inbound shipments of crude oil from Russia and put a cap of $60 a barrel on EU companies doing business facilitating Russian oil shipments elsewhere in the world. At a meeting over the weekend the OPEC oil cartel lefts its collective crude oil production unchanged. Meantime, the yield on the benchmark U.S. 10-year Treasury note is presently 3.57%.

Technically,February gold futures prices hit a 3.5-month high early on today and then reversed course to score a bearish "outside day" down on the daily bar chart. The gold futures bulls still have the overall near-term technical advantage but faded today. Prices are in a four-week-old uptrend on the daily bar chart. Bulls' next upside price objective is to produce a close above solid resistance at today's high of $1,822.90. Bears' next near-term downside price objective is pushing futures prices below solid technical support at $1,733.50. First resistance is seen at $1,800.00 and then at the November high of $1,806.00. First support is seen at $1,770.00 and then at $1,750.00. Wyckoff's Market Rating: 6.0Live 24 hours silver chart [

March silver futures prices hit a seven-month high early on today but then reversed course to score a bearish "outside day" down on the daily bar chart. The silver bulls still have the overall near-term technical advantage but faded today. Prices are in a choppy three-month-old uptrend on the daily bar chart. Silver bulls' next upside price objective is closing prices above solid technical resistance at $24.00. The next downside price objective for the bears is closing prices below solid support at $20.79. First resistance is seen at $23.00 and then at today's high of $23.69. Next support is seen at $22.00 and then at $21.435. Wyckoff's Market Rating: 6.0.

March N.Y. copper closed down 440 points at 380.60 cents today. Prices closed near the session low today after hitting a three-week high early on. The copper bulls have the overall near-term technical advantage. Copper bulls' next upside price objective is pushing and closing prices above solid technical resistance at the November high of 394.70 cents. The next downside price objective for the bears is closing prices below solid technical support at 354.70 cents. First resistance is seen at today's high of 389.45 cents and then at 394.70 cents. First support is seen at 373.50 cents and then at 365.00 cents. Wyckoff's Market Rating: 6.0.

By Jim Wyckoff

For Kitco News

Time to Buy Gold and Silver

David

Will $1,800 bring the gold bulls back? Analysts look for follow-through buying next week

Will $1,800 bring the gold bulls back? Analysts look for follow-through buying next week

rowing expectations that the Federal Reserve will slow the pace of rate hikes are creating new momentum in the gold market as prices ended the week above $1,800 an ounce. However, some analysts aren't entirely convinced that new capital is coming into the market.

Analysts said they are anxious to see if the precious metal can attract some follow-through buying next week and solidly break out above its 200-day moving average, something it hasn't done since February.

Not only is gold starting December off on the front foot, but its 7% rally during November was its best performance since May 2021.

Gold's solid finish to the week comes after the U.S. government reported substantial employment gains and higher wages for November.

Friday, the Bureau of Labor Statistics said 263,000 jobs were created in November; economists expected job gains of 200,000. At the same time, wages increased 5.1% for the year, well above expectations.

Ole Hansen, head of commodity strategy at Saxo Bank, said that sentiment is improving with traders now looking to buy the dips instead of selling the rallies; however, he added that there is still little bullish conviction in the market and that needs to change if prices are going to consolidate at current levels.

"From a momentum perspective, we still need to do a little bit more work," he said. "Momentum traders are still not in a hurry to get into gold."

Kevin Grady, president of Phoenix Futures and Options, said that gold's future remains tied to the Federal Reserve and its aggressive monetary policy stance.

Gold's month-end rally started in earnest Wednesday after Federal Reserve Chair Jerome Powell said it could be appropriate for the U.S. central bank to slow its pace of tightening in December.

However, Grady noted that despite the dovish tilt, the Federal Reserve will continue to raise interest rates and that will keep many gold investors on the sidelines.

Bitcoin price dips below $17K as recession fears rise to the surface

He added that he sees the current rally as further short-covering, which is not sustainable.

"You don't want to be short gold if the Fed is going to raise interest rates by 50 basis points," he said. "But people are not saying let's get long gold at $1,800; they are saying let's not be short."

Edward Moya, senior North American market analyst at OANDA, said that given gold's move this past week, he would expect to see some consolidation in the near term.

He added that next week is a relatively quiet one for economic data and traders will probably keep a low profile as they wait for the Federal Reserve's monetary policy decision on Dec. 14.

However, he added that he would look to buy gold as it tests the bottom of its new trading range.

"I'm slightly bearish on gold right now, but if it drops $20 from here, then I would be bullish," he said.

Moya added that long-term, although the jobs data remains persistently strong, other areas of the economy continue to weaken.

He said that after the holidays, he expects to see significant demand destruction as consumers try to pay their bills. This environment will force the Federal Reserve to slow the pace of its rate hikes and even lead to the much-awaited pivot.

"Inflation is still going to be sticky and tricky to navigate, but we are not seeing a risk that the Fed Funds rate goes to 6%," he said. "The Fed is still going to downshift and that will be good for gold."

Heading into the weekend, the CME Fed Watch Tool shows that markets see a nearly 80% chance that the Federal Reserve will raise interest rates by 50 basis points later this month. Markets still see a terminal rate between 5.0% and 5.25%.

Along with economic data, market analysts warn investors to keep an eye on headlines surrounding next week's OPEC+ output decision.

The group of 23 oil-producing nations led by Saudi Arabia and Russia will meet Sunday, with markets expecting the group to announce more production cuts, which would increase fears of a recession and higher inflation.

Next week's data

Monday: ISM services PMI, Reserve Bank of Australia monetary policy decision

Wednesday: Bank of Canada monetary policy decision

Friday: Producer Price Index, preliminary University of Michigan Consumer Sentiment

By Neils Christensen

For Kitco News

Time to Buy Gold and Silver

David

Solid performances from gold & silver and a jobs report above expectations

Solid performances from gold & silver and a jobs report above expectations

Solid performances from gold & silver and a jobs report above expectations

Both gold and silver had stellar performances this week. This week the precious metals moved on both the jobs report and chairman Powell’s speech on Wednesday.

Gold futures opened today at $1817 and traded to a low of $1791.80 before substantially recovering. As of 4:00 PM EST, the most active February 2023 contract is fixed at $1812.20 after factoring in today’s price decline of $3.10. Silver futures basis the most active March contract opened at $22.975, traded to a low of $22.48, and is currently fixed at $23.37 after factoring in today’s gain of $0.529 or 2.32%. The primary reason that gold had a fractional decline and silver had a solid gain was today’s jobs report which was bullish for silver and slightly bearish for gold.

However, the weekly gains in both gold and silver reveal a more complete story, with the precious metals reacting to an abundant amount of the major events this week. Gold futures opened on Monday at $1756 and is currently fixed at $1812.20 posting a weekly net gain of approximately $56 or 3.189%. Silver’s performance was even more stellar this week opening at $21.52 and is currently fixed at $23.365 resulting in a weekly gain of approximately $1.85 or 8.66%.

The November jobs report

By far the largest factor moving the precious metals this week was Wednesday’s speech by Chairman Jerome Powell in Washington. The jobs report could have a nuanced effect on the Federal Reserve’s upcoming rate hikes as well. Last month resulted in 263,000 additional jobs. Although this is the lowest number since December 2020, November’s additional jobs came in well above forecasts. Economists surveyed by Refinitiv predicted that only 200,000 new jobs were added last month. The unemployment rate remained at 3.7%. The report revealed that the labor market continues to be extremely tight resulting in a smaller number of individuals being hired for holiday employment. The report will also factor into the decisions of Federal Reserve members as they meet this month for the last FOMC meeting of the year. Gold traded fractionally lower, in response to today’s nonfarm payroll jobs report.

Levels to watch in gold futures from now until the end of Q1 2023

Technical evidence now supports the fact that market sentiment for gold had a major shift expressed in the charts as a reversal from exceedingly bearish to bullish beginning in November. The chart above is a daily candlestick chart of gold futures.

November 3 marked the beginning of a major rally in gold. After trading to a low of $1621 gold prices have surged to a high of $1818.70 today. This has resulted in gold prices gaining approximately 10.54% in the last month.

Our technical studies indicate that the current level of support is between $1790 and $1802. The upper level of support is based on the 200-day moving average, and the lower level is based on the most recent top of $1791 that occurred in the middle of November. We also see a much wider band of resistance with minor resistance occurring at $1824.60 based on a top that occurred during the first week of August and major resistance at $1883 which is based upon a top that occurred during the first part of June.

We have also created a Fibonacci extension to forecast where gold prices could go by the end of Q1 – Q2 2023. This was created by measuring the price gains from the low of $1621 on November 3 to the high achieved in mid-November at $1791.30. We then began a Fibonacci extension from the minor correction that occurred towards the end of November when gold prices sold off to a low of $1719. Based on this study we are predicting that gold could trade as high as $1955 by the middle of 2023.

The largest takeaway from recent changes in the price of gold is that the rally which began on November 3 is signaling that a major pivot of market sentiment by investors in both gold and silver from bearish to bullish took place. Our technical studies presented today indicate that it is likely that that rally will continue not only through the end of this year but into the first half of 2023.

By Gary Wagner

Contributing to kitco.com

Time to Buy Gold and Silver

David