Gold posts solid gains for the week as market participants focus on the economy

Gold posts solid gains for the week as market participants focus on the economy

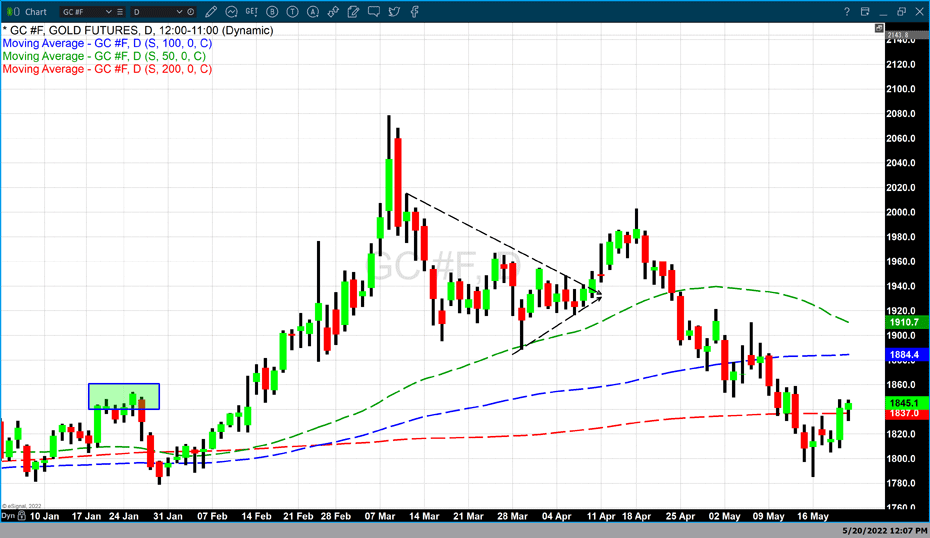
Gold prices closed higher on the day and the week resulting in solid gains. As of 5:50 PM, ET gold futures basis most active June contract is currently up $3.90 or 0.21% fixed at $1845.10. Considering that gold futures traded to a low this week of $1785 and closed near the highest value this week of $1848.60 gold had a good week.

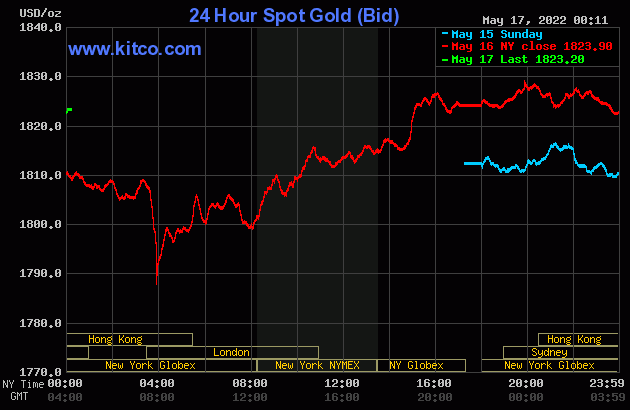
Gold pricing had been under pressure for the fourth consecutive week before this week’s trading activity resulting in defined technical chart damage with gold breaking below its 200-day moving average last Thursday, May 12. This week’s low occurred on Monday, May 16 when gold prices hit a low of $1785, and traded to a high of $1825 before closing above its opening price on Monday and above Friday’s closing price at $1813.60. On Tuesday gold traded to a higher high and a higher low than Monday, even though gold closed fractionally lower than its opening price. On Wednesday gold traded to a lower low and a lower high than Tuesday’s price action but that all changed on Thursday.

Thursday’s price action moved gold solidly higher opening at $1816 and closing at $1841, above its 200-day moving average of $1837. Although today gold had only a small gain it opened and closed above its 200-day moving average which on a technical basis is significant. If gold can maintain pricing above $1837 on a technical basis, we can derive that gold prices are now back in a solid long-term bullish demeanor.
The recovery in gold this week was based upon market sentiment shifting their attention from the recent and future activities of the Federal Reserve in regards to their tightening monetary policy in which they have raised the Fed funds rate by ½ a percent at this month’s FOMC meeting which follows the quarter-percent rate hike they enacted in March. Recent statements by Chairman Powell indicated that they will get more aggressive when he said that he is open to raising rates well above the Federal Reserve’s interest rate target for normalization which is been set at approximately 2%. This was interpreted as a more aggressive monetary policy in an attempt to stop inflation from spiraling higher.

Statements from the Federal Reserve before this week were indicating that they believe that inflationary pressures had peaked and using the most recent numbers from last month’s CPI inflation index is the validation of that assumption. The CPI index came in at 8.3% for April, below the 8.5% rate that occurred in March.

It has been the tightening of the Federal Reserve’s monetary policy which has resulted in a tremendous selloff in U.S. equities which continue through this week taking all three major indices into a defined tailspin with seven consecutive weeks of price declines.

However, gold had been selling off for the last four consecutive trading weeks based upon anticipation of much higher interest rates to stave off inflation. However, this week we have seen a clear and defined reversal of market sentiment as investors are now clearly focused on the reality that inflation has not peaked and is most likely continuing to move higher and the prolonged risk-off market sentiment has shifted market sentiment from the higher yields of U.S. Treasuries to the safe-haven asset; gold

By Gary Wagner

Contributing to kitco.com

Time to buy Gold and Silver on the dips

David
Gold, silver see solid gains as USDX slumps

Gold, silver see solid gains as USDX slumps

Gold and silver prices are posting good gains in midday U.S. trading Thursday. The precious metals are boosted by a sharply lower U.S. dollar index and a slight decline in U.S. Treasury yields on this day. A wobbly U.S. stock market is also working in favor of the metals market bulls. June gold futures were last up $25.40 at $1,841.30. July Comex silver futures were last up $0.321 at $21.86 an ounce.

U.S. stock indexes have seen strong selling pressure recently and are near 12-month lows amid heightened worries about corporate earnings after Wal Mart and Target posted dismal results this week. Both companies cited inflation as the main culprit for their dour earnings numbers. An economic recession in the U.S. is now on the minds of traders and investors who were already saddled with other concerns, including the Russia-Ukraine war and Covid cases causing major cities in China to be on lockdown, which is disrupting global trade. Those concerns are also prompting some safe-haven demand for gold and silver.

U.S. dollar will keep gold price under pressure – VanEcK's Foster and Casanova

The key outside markets today see Nymex crude oil futures prices firmer and trading around $110.00 a barrel. Meantime, the U.S. dollar index is sharply lower and hit a two-week low. The yield on the 10-year U.S. Treasury note is fetching 2.837%.

Technically, June gold futures see a nine-week-old price downtrend still in place on the daily bar chart. Bears have the firm overall near-term technical advantage. Bulls' next upside price objective is to produce a close above solid resistance at $1,900.00. Bears' next near-term downside price objective is pushing futures prices below solid technical support at the May low of $1,785.00. First resistance is seen at today's high of $1,848.20 and then at $1,875.00. First support is seen at $1,825.00 and then at today's low of $1,808.40. Wyckoff's Market Rating: 3.5

July silver futures prices scored a bullish "outside day" up on the daily bar chart today. A price downtrend is in place on the daily bar chart. The silver bears have the solid overall near-term technical advantage. Silver bulls' next upside price objective is closing prices above solid technical resistance at $23.00 an ounce. The next downside price objective for the bears is closing prices below solid support at the May low of $20.42. First resistance is seen at $22.25 and then at $22.50. Next support is seen at today's low of $21.25 and then at $21.00. Wyckoff's Market Rating: 2.5.

July N.Y. copper closed up 1,045 points at 428.30 cents today. Prices closed near the session high today. The copper bears still have the firm overall near-term technical advantage. A price downtrend is still in place on the daily bar chart. However, more gains in the near term would negate the downtrend. Copper bulls' next upside price objective is pushing and closing prices above solid technical resistance at 445.00 cents. The next downside price objective for the bears is closing prices below solid technical support at the May low of 403.70 cents. First resistance is seen at 430.00 cents and then at 435.00 cents. First support is seen at 420.00 cents and then at this week's low of 413.15 cents. Wyckoff's Market Rating: 2.5.

By Jim Wyckoff

For Kitco News

Time to buy Gold and Silver on the dips


David
Gold recovers early losses as U.S. stock market melts down

Gold recovers early losses as U.S. stock market melts down

Gold prices are up a bit at midday Wednesday. The yellow metal recovered moderate early losses as some safe-haven demand surfaced amid a big sell off in the U.S. stock market at mid-week. June gold futures were last up $1.40 at $1,820.50. July Comex silver futures were last down $0.11 at $21.64 an ounce.

Global stock markets were mixed overnight. U.S. stock indexes are sharply lower on corrective pullbacks following gains on Tuesday. A big earnings miss from Target help sink the stock market at mid-week. Traders and investors are also tentative on new reports that Covid continues to spread in China, after reports earlier this week that said China's government could ease up on its lockdowns.

Federal Reserve Chairman Jerome Powell on Tuesday afternoon reiterated the central bank's main goal is to tamp down inflation, even if it means pushing up the unemployment rate. He said the Fed "has the tools and resolve" to cool inflation. The marketplace read his latest comments as maybe not surprising but certainly hawkish.

2022's $1 trillion crypto wipeout: 'necessary cleansing' of excess speculation just like dot-com bubble – Bloomberg Intelligence

The key outside markets today see Nymex crude oil futures prices lower and trading around $110.00 a barrel. Meantime, the U.S. dollar index is higher in midday trading. The yield on the 10-year U.S. Treasury note is fetching around 2.9%.

Technically, June gold futures see a nine-week-old price downtrend in place on the daily bar chart. Bears have the solid overall near-term technical advantage. Bulls' next upside price objective is to produce a close above solid resistance at $1,875.00. Bears' next near-term downside price objective is pushing futures prices below solid technical support at $1,750.00. First resistance is seen at this week's high of $1,834.80 and then at $1,850.00. First support is seen at today's low of $1,805.00 and then at $1,800.00. Wyckoff's Market Rating: 3.0.

July silver futures see a steep price downtrend in place on the daily bar chart. The silver bears have the solid overall near-term technical advantage. Silver bulls' next upside price objective is closing prices above solid technical resistance at $23.00 an ounce. The next downside price objective for the bears is closing prices below solid support at $20.00. First resistance is seen at this week's high of $21.925 and then at $22.00. Next support is seen at today's low of $21.38 and then at $21.00. Wyckoff's Market Rating: 2.0.

July N.Y. copper closed down 550 points at 418.25 cents today. Prices closed nearer the session low today. The copper bears have the solid overall near-term technical advantage. A price downtrend is still in place on the daily bar chart. Copper bulls' next upside price objective is pushing and closing prices above solid technical resistance at 445.00 cents. The next downside price objective for the bears is closing prices below solid technical support at 400.00 cents. First resistance is seen at today's high of 424.80 cents this week's high of 428.25 cents. First support is seen at today's low of 416.10 cents and then at this week's low of 413.35 cents. Wyckoff's Market Rating: 2.0.

By Jim Wyckoff

For Kitco News

Time to buy Gold and Silver on the dips

David

Gold, silver up, but gains fade after upbeat U.S. economic data

Gold, silver up, but gains fade after upbeat U.S. economic data

Gold and silver prices are just modestly higher in midday U.S. trading Tuesday and lost solid early gains after some stronger-than-expected U.S. economic data and rising U.S. bond yields. The metals were supported by rising crude oil prices that hit a nine-week high earlier today, and sharp daily losses in the U.S. dollar index. However, crude oil prices did back down as the session progressed. June gold futures were last up $2.50 at $1,816.50. July Comex silver futures were last up $0.134 at $21.685 an ounce.

The U.S. retail sales report for April showed a rise of 0.9%, which was close to market expectations. However, March retail sales were revised up to 1.4%. April U.S. industrial production for March came in strong at up 1.1% versus expectations for a rise of 0.5%. After these reports’ releases the metals started to ratchet down from their overnight highs.

U.S. stock indexes are higher at midday. The marketplace is more upbeat Tuesday on reports China will start to ease its lockdowns in major cities, including Hong Kong and Shanghai.

The marketplace will be watching a scheduled Wall Street Journal interview with Fed Chairman Jerome Powell this afternoon. Traders and investors will be keen to see if Powell remarks on timing aspects of Fed monetary policy and/or inflation, as well as the prospect of the U.S. economy entering a recession.

Gold faces new competition as real yields turn positive – USBWM

The key outside markets today see Nymex crude oil futures prices weaker after hitting a nine-week high early on, and is presently trading around $113.00 a barrel. Meantime, the U.S. dollar index is lower. The yield on the 10-year U.S. Treasury note is fetching around 2.9%.

Technically, June gold futures prices see a nine-week-old price downtrend in place on the daily bar chart. Bears have the solid overall near-term technical advantage. Bulls' next upside price objective is to produce a close above solid resistance at $1,875.00. Bears' next near-term downside price objective is pushing futures prices below solid technical support at $1,750.00. First resistance is seen at today’s high of $1,834.80 and then at $1,850.00. First support is seen at $1,800.00 and then at this week’s low of $1,785.00. Wyckoff's Market Rating: 3.0

July silver futures see a steep price downtrend in place on the daily bar chart. The silver bears have the solid overall near-term technical advantage. Silver bulls' next upside price objective is closing prices above solid technical resistance at $23.00 an ounce. The next downside price objective for the bears is closing prices below solid support at $20.00. First resistance is seen at $22.00 and then at $22.50. Next support is seen at $21.50 and then at $21.00. Wyckoff's Market Rating: 2.0.

July N.Y. copper closed up 445 points at 423.50 cents today. Prices closed nearer the session low today. The copper bears have the solid overall near-term technical advantage. A price downtrend is still in place on the daily bar chart. Copper bulls' next upside price objective is pushing and closing prices above solid technical resistance at 445.00 cents. The next downside price objective for the bears is closing prices below solid technical support at 400.00 cents. First resistance is seen at today’s high of 428.35 cents 430.00 cents. First support is seen at today’s low of 420.30 cents and then at this week’s low of 413.35 cents. Wyckoff's Market Rating: 2.5.

By Jim Wyckoff

For Kitco News

Time to buy Gold and Silver on the dips


David

Short-covering in gold silver; bulls have more heavy lifting ahead

Short-covering in gold silver; bulls have more heavy lifting ahead

Gold and silver prices are higher, with silver sharply up, in midday U.S. trading Monday. Gold hit a nearly four-month low overnight. Short covering by the shorter-term futures traders was featured on this first day of the trading week. A weaker U.S. dollar index, higher crude oil prices and lower bond yields on this day also worked in favor of the metals markets bulls. However, the bulls need to put together some solid price-gain days to begin to repair recent chart damage. June gold futures were last up $4.70 at $1,813.10. July Comex silver futures were last up $0.479 at $21.48 an ounce.

Global stock markets were mixed but mostly lower overnight. U.S. stock indexes are mixed at midday. The S&P 500 stock index last week had its worse week in 11 years. The U.S. index is now flirting with being in a bear market that is defined by the indexes being down 20% from its recent high. The Russia-Ukraine war, Covid lockdowns in China and inflation fears are hitting the equities hard. The risk aversion seen in the marketplace recently is bullish for gold and silver, but bulls have been perplexed their metals have not seen much upside price performance by such.

U.S. dollar could dominate gold price through the summer – analysts

The key outside markets today see Nymex crude oil futures prices higher, at a two-month high and trading around $112.50 a barrel. Meantime, the U.S. dollar index is lower in midday trading. The yield on the 10-year U.S. Treasury note is fetching 2.86%.

Technically, June gold futures prices hit a nearly four-month low early on today. A nine-week-old price downtrend is in place on the daily bar chart. Bears have the solid overall near-term technical advantage. Bulls' next upside price objective is to produce a close above solid resistance at $1,875.00. Bears' next near-term downside price objective is pushing futures prices below solid technical support at $1,750.00. First resistance is seen at Friday’s high of $1,827.60 and then at $1,850.00. First support is seen at $1,800.00 and then at today’s low of $1,785.00. Wyckoff's Market Rating: 3.0

July silver futures saw short covering featured. Prices hit a 22-month low Friday. A steep price downtrend is in place on the daily bar chart. The silver bears have the solid overall near-term technical advantage. Silver bulls' next upside price objective is closing prices above solid technical resistance at $23.00 an ounce. The next downside price objective for the bears is closing prices below solid support at $20.00. First resistance is seen at $21.625 and then at $22.00. Next support is seen at $21.00 and then at today’s low of $20.835. Wyckoff's Market Rating: 1.5.

July N.Y. copper closed up 115 points at 418.65 cents today. Prices closed nearer the session high today. The copper bears have the solid overall near-term technical advantage. A steep price downtrend is in place on the daily bar chart. Copper bulls' next upside price objective is pushing and closing prices above solid technical resistance at 440.00 cents. The next downside price objective for the bears is closing prices below solid technical support at 400.00 cents. First resistance is seen at today’s high of 420.60 cents 425.00 cents. First support is seen at today’s low of 413.35 cents and then at 410.00 cents. Wyckoff's Market Rating: 2.0.

By Jim Wyckoff

For Kitco News

Time to buy Gold and Silver on the dips


David

Gold price in 5 years: $1,300 or $4,000?

Gold price in 5 years: $1,300 or $4,000?

A massive selloff in U.S. stocks, extreme panic in the crypto space, and the worst week for gold in almost a year are just a few headlines that describe the volatility seen all across the board. Here's a look at Kitco's top three stories of the week:

3. 'Extreme panic' in crypto: How risky is Bitcoin price below $30k?

2. Gold price is in a 'danger zone'

1. Gold price's 5-year outlook: $1,300 or $4,000? MKS PAMP weighs in


By Anna Golubova

For Kitco News

Time to buy Gold and Silver on the dips


David

Gold price sees worst week in 11 months, but is the market oversold?

Gold price sees worst week in 11 months, but is the market oversold?

The gold market is looking to close the week down around 4%, its worst weekly close since mid-June 2021. But its current price level of around $1,800 an ounce could put gold at risk of a bigger selloff, according to analysts.

Gold was hurt by technical selling pressure after dropping below the $1,830 an ounce Thursday, which served as support. The precious metals also suffered from higher U.S. dollar and expectations of an aggressive Federal Reserve following hotter-than-expected inflation data.

June Comex gold futures were last at $1,809.90 an ounce, down more than $70 on the week.

"We've seen the CPI come in stronger than expected this week. The 8.3% pace in April is problematic, especially after markets were expecting 8.1%. That automatically told us that the Federal Reserve would not soften its hawkish stance," TD Securities head of global strategy Bart Melek told Kitco News. "It's unlikely that inflation will come off sharply any time soon."

This outlook has weighed on gold and the precious metal moved significantly lower. "The $1,830 was good support, but we breached it. Now, $1,790 is the next support level as gold consolidates," Melek said.

Gold was also used this week for liquidity purposes amid a massive selloff in U.S. equities, with the S&P 500 falling 18% since the end of December.

"Gold's decline is investors covering losses elsewhere. Liquidation for traders and investors to make up for major losses seen in equity markets. Gold is one of the easiest things to convert into cash when times are tough," Gainesville Coins precious metals expert Everett Millman said Friday.

Looking into next week, if $1,800 is breached, gold is at risk of a steeper selloff. But traders should widen their trading range for gold in the short-term due to ongoing volatility in all markets, Millman added.

"Risk of falling further below $1,800 is present right now, more so than ever before this year. We are likely to see a lot of sideways trading," he told Kitco News. "Even with elevated downside risk, we still can get back above $1,900 in a matter of weeks. Traders need to widen gold's range due to the side effect of heightened volatility."

Gold price is manipulated by the Fed, suspects mining tycoon Frank Giustra, but suppression can't last forever
The $1,830 to $1,790 is the likely range for gold next week, said Melek. "There is a risk of gold dropping even lower, especially if we see better than expected economic numbers, elevated energy prices, or disappointment in crop data. If the Fed rate hike estimates move up, gold gets hit a bit more," he added.

A lot of money was pulled out of all markets this week, including equities, crypto, and gold, said RJO Futures senior market strategist Frank Cholly. What matters now is the technicals, which is the $1,800 an ounce level for gold.

"It is a big level, and $1,775 could be in the cards as well," he told Kitco News. "The market at least pauses here and goes sideways as it builds another base and recovers. We've taken a lot of premium out of the market."

The gold market is now oversold, and it won't be surprising to see a bounce back to $1,865 an ounce and then to $1,900 an ounce, Cholly added. "The selling in gold is overdone, and it is closer to the bottom than the top at this level," he said. "A close above $1,840-$1,850 is necessary to encourage the move. Investors have to watch the U.S. dollar and interest rates."

Data to watch

Monday: NY Empire State manufacturing index

Tuesday: Retail sales, industrial production, Fed Chair Powell speaks at the Wall Street Journal Future of Everything Festival

Thursday: jobless claims, Philadelphia Fed manufacturing index

By Anna Golubova

For Kitco News

Time to buy Gold and Silver on the dips


David

Gold lost 3.82% this week, resulting in a fourth consecutive weekly decline

Gold lost 3.82% this week, resulting in a fourth consecutive weekly decline

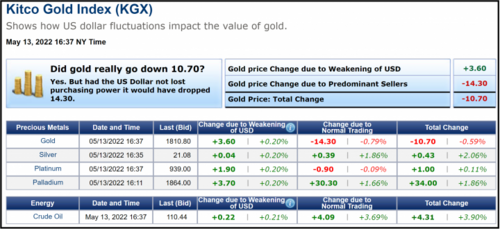
Gold opened at $1977 on Monday, April 18, and this would mark the beginning of four consecutive weekly declines. As of 5:10 PM EDT gold futures basis, the most active June 2022 Comex contract is fixed at $1810.30 after factoring in today’s decline of $14.30 or 0.78%. Today’s decline in gold occurred without the benefit of dollar strength. The dollar index declined by 0.36% and is currently fixed at 104.515

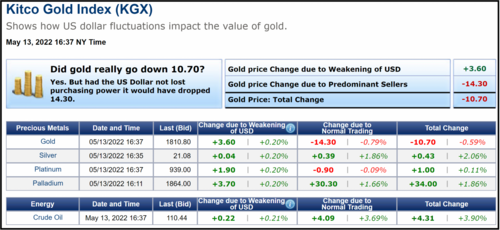
The image above is a screen-print of the KGX (Kitco Gold Index) which was taken at 4:37 PM EDT. At that time spot gold was fixed at $1810.80 after factoring in a decline of $10.70. Market participants were active sellers resulting in a $14.30 price decline. Dollar weakness provided mild tailwinds adding $3.60 (+0.20%) in value.

The decline this week was the strongest percentage drawdown of the four weeks losing 3.87%. Considering that over the last four weeks gold’s value has decreased by 8.44%, almost half of that decline occurred this week. This correction devalued the price of gold by $167 per ounce, with $73 of that decline occurring this week.

Over the last four weeks, a major factor pressuring gold prices lower has been dollar strength. The dollar has gained value for the last six consecutive weeks. Over the last four trading weeks, the U.S. dollar has gained 4.15% in value. This means that dollar strength accounted for just under one-half of gold’s price decline.

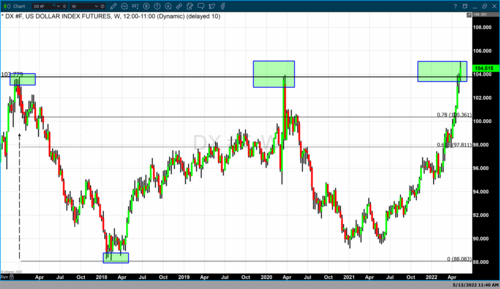
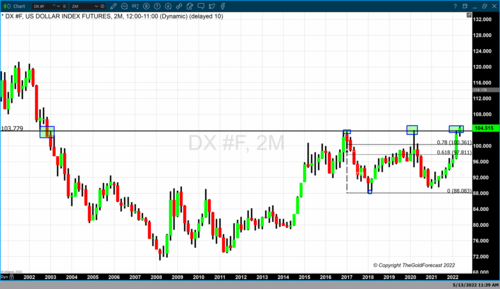
The dollar has been trading in a defined range since the beginning of 2017. In January 2017 the dollar index opened at 102.80 and traded to a high of 103. 78 becoming the first instance of dollar strength at this level since 2003. Since 2017 the dollar index has traded to this level on three occasions.

Both the 2017 top as well as the second instance which occurred in March 2020 created a double top. In both instances, dollar strength peaked at these levels resulting in a price correction that followed these tops. This month the dollar not only challenged the highs created during the double top but effectively closed above them on a daily, weekly, and monthly chart.

The dollar index declined today by – 0.36%. However, the dollar had a strong weekly gain. Currently, the dollar index is fixed at 104.515 and the last time the dollar was this strong was the fourth quarter of 2002.

Yesterday I addressed that recent price changes in the dollar and gold have been headlined driven based upon fundamental events. Because technical studies by nature are lagging indicators there is an inherent disconnect. I was blessed to be mentored by two great market technicians one being Larry Williams. He told me a story that illustrated the shortcoming of only using technical indicators.

To paraphrase: A market technician is analogous to someone standing at the stern of a boat and using the wake from the propeller to indicate the direction the ship was headed. While it indicated where the boat had been, only the captain knows when he will turn the wheel.

In this instance the Federal Reserve is at the helm attempting to steer the ship through a storm brought on by rampant inflation.

By Gary Wagner

Contributing to kitco.com

Time to buy Gold and Silver on the dips


David

Gold, silver punished by strong USDX that hits 20-year high

Gold, silver punished by strong USDX that hits 20-year high

Gold and silver prices are sharply lower in midday U.S. trading Thursday, pressured in part by a very strong U.S. dollar index that today scored a 20-year high. Bearish charts are also keeping the technically based bears active on the sell side in the futures markets. June gold futures were last down $19.20 at $1,834.50. July Comex silver futures hit a 22-month low today and were last down $0.70 at $20.87 an ounce.

Global stock markets were mostly lower overnight. U.S. stock indexes are lower at midday and hit 12-month lows. Risk aversion remains elevated amid the Russia-Ukraine war that shows no signs of ending, Covid lockdowns in China and problematic price inflation that is gripping the globe. Traders worry the U.S. and other major economies will slip into recession in the coming months, due to the aforementioned factors.

The U.S. got another inflation reading Thursday with the producer price index for April, which came in up 11%, year-on-year. That was down just a bit from the March PPI reading of up 11.5%, but still hot nonetheless.

Nothing can fix inflation now, 'economic stupidity' is underway by the Fed, Biden – Steve Hanke

In other news, the crypto currencies continue to get hammered amid the keener risk aversion in the marketplace. Bitcoin prices dropped to a 16-month low below $26,000 overnight.

The key outside markets today see Nymex crude oil futures prices up a bit and trading around $106.00 a barrel. Meantime, the U.S. dollar index is sharply higher and hit a 20-year high. The yield on the 10-year U.S. Treasury note is fetching 2.846%.

Technically, June gold futures see a two-month-old price downtrend in place on the daily bar chart. Bears have the firm overall near-term technical advantage. Bulls' next upside price objective is to produce a close above solid resistance at $1,900.00. Bears' next near-term downside price objective is pushing futures prices below solid technical support at $1,800.00. First resistance is seen at today’s high of $1,858.80 and then at $1,864.70. First support is seen at this week’s low of $1,830.60 and then at $1,815.00. Wyckoff's Market Rating: 3.0.

July silver futures prices closed nearer the session low and hit a 22-month low today. A steep price downtrend is in place on the daily bar chart. The silver bears have the solid overall near-term technical advantage. Silver bulls' next upside price objective is closing prices above solid technical resistance at $22.50 an ounce. The next downside price objective for the bears is closing prices below solid support at $20.00. First resistance is seen at today’s high of $21.625 and then at $22.00. Next support is seen at today’s low of $20.705 and then at $20.50. Wyckoff's Market Rating: 1.0.

July N.Y. copper closed down 1,225 points at 408.75 cents today. Prices closed nearer the session high today and hit a 7.5-month low. The copper bears have the solid overall near-term technical advantage. A steep price downtrend is in place on the daily bar chart. Copper bulls' next upside price objective is pushing and closing prices above solid technical resistance at 435.00 cents. The next downside price objective for the bears is closing prices below solid technical support at 400.00 cents. First resistance is seen at 415.00 cents 420.00 cents. First support is seen at today’s low of 403.70 cents and then at 400.00 cents. Wyckoff's Market Rating: 1.5.

By Jim Wyckoff

For Kitco News

Time to buy Gold and Silver on the dips

David

Gold price on ‘cusp’ of $2k rally, here’s how not to miss it – Bloomberg Intelligence

Gold price on 'cusp' of $2k rally, here's how not to miss it – Bloomberg Intelligence

After a disappointing May start, gold could be on a cusp of a major breakout above $2,000 an ounce, according to Bloomberg Intelligence.

After falling 6.5% in the last month, gold is now near a bottom, with the $1,800 an ounce serving as a floor for prices, Bloomberg Intelligence senior commodity strategist Mike McGlone told Kitco News.

Investors have been reevaluating their risk-on positions as the Federal Reserve looks to tighten by 50-basis-points in June and June as it fights inflation.

"Gold is near a bottom and on the cusp of a pretty significant breakout — when it gets above $2,000 an ounce and never looks back," McGlone said. "One day, we're going to wake up, and gold is going to pop above $2,000 an ounce, which is resistance that will be converted into support, and never look back."

The $2,000 an ounce level has been a critical psychological resistance point for gold, which the precious metal failed to sustainably breach this year despite coming close in March.

Gold's main obstacles in the second quarter have been rising U.S. yields and a strong U.S. dollar. This is especially visible when gold's USD performance is compared to yen or euro.

"The dollar strength is putting pressure on the price of gold in terms of the U.S dollar. In terms of the yen, gold is up 20%. In terms of the euro, gold is up 15%. In terms of the U.S. dollar, it's flat. So people holding gold in Europe and Japan are performing much better. It's been a good hedge against their currency declining. It's just a matter of time before but catches up in the U.S. dollar," McGlone explained. "But once you reduce that headwind, which I think we're on the cusp of, gold should take off, and that's just based on past performance."

One of the drivers to trigger the next rally will be markets shifting gears to price the end of the Federal Reserve's tightening cycle. And that is already starting to happen, McGlone pointed out.

"This week was the first good sign that I've seen in a while. I use the one-year-out fed funds future (FF13) for hike expectations. And they are just starting to take away some of that tightening. Why are they doing it? Because the stock market has reached an inflection point of weakness," he said. "I'm looking at bond yields potentially peaking at 3% in the 10-year and the fed funds peaking around 3.4% and dropping to 3%."

The Nasdaq is already down 23% on the year. And this is helping the U.S. stock market reach that inflection point, where Fed's rate hike expectations will be reduced.

"The market is heading that way. We're at that point where the stock market going down is enough to help take the Fed's tightening out of the market and alleviate inflation and shift us back over to a deflationary environment. That's been some of the best foundation for gold in the last few years when gold bottomed in 2015 and 2018," McGlone said.

Gold price is manipulated by the Fed, suspects mining tycoon Frank Giustra, but suppression can't last forever
According to McGlone, the big problem facing the Fed in the long term is not inflation but deflation. "A year from now, when you get April CPI [consumer price index], it'll be much lower, and even negative," he noted.

McGlone did note that it's an if statement. "The Fed wants the stock market down because they need to reduce the ability for people to buy stuff. And I think that's just started to happen."

Crude oil, for example, is very likely to drop to $50 rather than rise to $200. And if the U.S. stock market continues to decline, it's "virtually a guarantee" that inflation will be lower on a 12-month basis. "You want to measure inflation from a big-picture point of view — 120 months. And that's where we see bond yields decline," he said. "The base effect for inflation will go down."

In this scenario, gold will be a primary asset to go to. But when allocating to gold, it is best to pair it with Bitcoin, McGlone added.

"Looking at modern portfolios, gold is naked if not paired with Bitcoin in portfolios," he stated. "Bitcoin is becoming global digital collateral. It's a small portion in virtually all portfolios, and it's gaining momentum. I don't see what stops those trends. Bitcoin's limited supply is a recipe for higher prices unless demand or adoption declines. And I see them rising."
 

By Anna Golubova

For Kitco News

Time to buy Gold and Silver on the dips

David