Gold price down but not out as Federal Reserve starts tightening cycle and lowers 2022 growth forecast and raises inflation expectations

Gold price down but not out as Federal Reserve starts tightening cycle and lowers 2022 growth forecast and raises inflation expectations

The gold market remains under selling pressure but has pushed off its session lows as the Federal Reserve starts a new tightening cycle even as it lowers its growth forecasts and raises its inflation outlook.

As expected, the Federal Reserve raised interest rates by 25 basis points, increasing the range to between 0.25 and 0.50%.

Gold prices were testing support just above $1,900 an ounce and have cut some of its losses in initial reaction as the U.S. treads a delicate course within a sea on instability, created by Russia’s war with Urkaine.

“The invasion of Ukraine by Russia is causing tremendous human and economic hardship. The implications for the U.S. economy are highly uncertain, but in the near term the invasion and related events are likely to create additional upward pressure on inflation and weigh on economic activity,” the Federal Reserve said in its monetary policy statement.

Not only is the Federal Reserve rasing interest rates but it is also planning to reduce its balance sheet "at a coming meeting."
 

Despite the growing uncertainty, the U.S. central bank signals that it continues to move forward with rate hikes in an environment of rising inflation and lower economic growth.

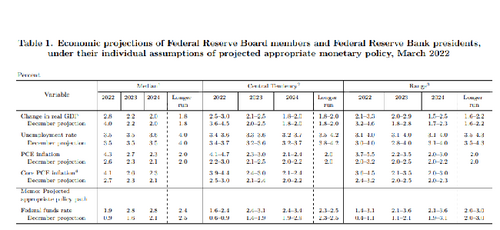
Federal Reserve’s interest rate projections, also known as the dot plots, have jumped from December’s forecast. The committee sees the Fed funds rate at 1.9% by the end of the year, up from December’s projections of 0.9%. The new media rate indicates at around seven rate hikes this year.

The Federal Reserve sees slightly slower growth this year as the conflict in Eastern Europe raises economic uncertainty. The Federal Reserve sees the U.S. gross domestic product growing 2.8% this year, down sharply from 4.0% forecasted in December. However, GDP growth is unchanged in 2023 and 2024 at 2.2% and 2.0% respectively.

At the same time, inflation pressures have risen sharply. The U.S. central bank sees core inflation, which strip out volatile food and energy prices, rising 4.1% this year, up compared to December’s estimate of 2.7%. Core inflation will remain elevated, rising 2.6% in 2023, up from the previous forecast of 2.3%. Looking to 2024, inflation is also higher at 2.3%, up from December’s projection of 2.1%.

Overall consumer prices are expected to rise 4.3% this year, up from December’s forecast of 2.6%. Next year headline inflation is expected to rise 2.7%, up from the previous estimate of 2.3%. for 2024 inflation is expected to rise 2.3%, up from the previous forecast of 2.1%.

The Federal Reserve sees a fairly stable labor market in the next two years with the unemployment rate holding steady at 3.5% this year and next, unchanged from December’s projections. The unemployment rate is expected to tick higher to 3.6% in 2024, up from the previous estimate of 3.5%.

While the Federal Reserve didn’t raise rates by 50 basis points as was expected earlier in the year, economists note that the central bank has come out with a strong hawkish stance.

“The Fed threw down the gauntlet as it confronted a broad inflation upsurge, twinning a widely expected and tame quarter point rate hike with a much sterner message about what lies ahead,” said Avery Shenfeld, senior economist at CIBC.

Shenfeld noted that not only does the Fed see seven rates hikes this year but are expected to rise 2.8% by the end of 2023.

Paul Ashworth, chief U.S. economist, also said that the Federal Reserve’s projections are on the hawkish side.

“The Fed's new economic projections suggest that officials are particularly worried about the potential for core inflation to remain high,” Ashworth said. “Even after the rally in rate expectations in recent days, the Fed's own projections are on the hawkish side.”

By Neils Christensen

For Kitco News

Time to buy Gold and Silver on the dips

David

Gold, silver in price downdrafts amid plunging oil, deteriorating charts

Gold, silver in price downdrafts amid plunging oil, deteriorating charts

Gold and silver prices are sharply lower in midday U.S. trading Tuesday. A huge drop in crude oil prices that sees Nymex futures trading back below $100 a barrel is bearish for the metals markets and the entire raw commodity sector. The near-term technical postures for gold and silver have also deteriorated significantly recently, which is inviting the chart-based speculative sellers to step in. April gold futures were last down $34.60 at $1,926.20 and May Comex silver was last down $0.188 at $25.11 an ounce.

Global stocks markets were mostly lower overnight. The U.S. stock indexes are solidly higher at midday. Trader and investor risk appetite remains elevated, overall, but there are some glimmers of hope that are pressing oil and gold prices down and bond yields up. Russia-Ukraine talks are continuing despite Russia stepping up its war campaign against Ukrainian citizens. Also, reports said high-level U.S.-China talks on the matter Monday were constructive.

China has locked down more cities due to the Covid virus again spreading rapidly. That has put price pressure on raw commodity futures markets early this week, on notions of reduced demand coming from the world’s second-largest economy.

The U.S. data point of the week is the Federal Reserve’s FOMC meeting that begins Tuesday morning and ends Wednesday afternoon with a statement. It’s widely believed the Fed will raise its Fed funds rate by 0.25%. The Fed and chairman Jay Powell’s comments on the war and inflation will be closely scrutinized by the marketplace.

Gold price and risk: metal off daily lows but surging yields, risk sentiment, and oil price crash weigh

Today’s latest U.S. inflation report out Tuesday morning saw the producer price index for February come at up 0.8% from January, which was just slightly less than expected. Still, the annual PPI rate is running very hot, at up 10%.

The key outside markets see Nymex crude oil prices sharply lower and trading around $96.50 a barrel. Crude prices have backed way off from last week’s 14-year highs. That strongly suggests oil prices may have put in at least near-term tops. The U.S. dollar index is a bit higher at midday. The benchmark U.S. 10-year Treasury note is presently yielding 2.10%. U.S. Treasury yields are on the rise and hit a 2.5-year high Monday.

Technically, April gold futures bulls have the overall near-term technical advantage but are fading fast. A V-Top reversal pattern appears to be forming on the daily bar chart and a six-week-old uptrend on the daily bar chart has been negated. Recent price action strongly suggests a market top is in place. Bulls' next upside price objective is to produce a close above solid resistance at $2,000.00. Bears' next near-term downside price objective is pushing futures prices below solid technical support at $1,900.00. First resistance is seen at $1,950.00 and then at today’s high of $1,956.90. First support is seen at today’s low of $1,908.60 and then at $1,900.00. Wyckoff's Market Rating: 6.0

700

May silver futures bulls still have the overall near-term technical advantage but are fading fast. A six-week-old uptrend on the daily chart has been negated. Silver bulls' next upside price objective is closing prices above solid technical resistance at the March high of $27.495 an ounce. The next downside price objective for the bears is closing prices below solid support at $24.00. First resistance is seen at today’s high of $25.315 and then at $25.50. Next support is seen at today’s low of $24.75 and then at $24.50. Wyckoff's Market Rating: 6.0.

May N.Y. copper closed down 155 points at 450.65 cents today. Prices closed near mid-range today. The copper bulls have lost their slight overall near-term technical advantage. Copper bulls' next upside price objective is pushing and closing prices above solid technical resistance at 480.00 cents. The next downside price objective for the bears is closing prices below solid technical support at the January low of 428.80 cents. First resistance is seen at this week’s high of 461.55 cents and then at 468.00 cents. First support is seen at today’s week’s low of 446.85 cents and then at 445.00 cents. Wyckoff's Market Rating: 5.0.

By Jim Wyckoff

For Kitco News

Time to buy Gold and Silver on the dips

David

Gold trades under pressure but currently holding the 38.2% retracement as support

Gold trades under pressure but currently holding the 38.2% retracement as support

As of 3:30 PM, EST gold is trading off by $29.20, or 1.46%, with the April 2022 Comex contract currently fixed at $1956.00. On a technical basis, today’s low of $1952 is just below the 38.2% Fibonacci retracement, which is currently at $1953.80. The data set used for this retracement begins at the low created in December 2021 when gold hit $1752.60 and began a dynamic rally which took pricing to a high of $2078.20 during the first week of March 2022. If gold breaks below the 38.2% Fibonacci retracement level, the next logical place that gold could trade to is the 50% retracement which is currently at $1915.40.

While Russia’s invasion of Ukraine continues, its massive assault market participants are focusing upon what actions the Federal Reserve will take this week. Traders are focusing on the amount of the Fed will raise rates, whether they will raise rates by ¼% as many Fed members have suggested, including Chairman Powell, or a more aggressive move to ½ a percent due to the ever-increasing rate of inflation. This would be the first interest rate hike since March 2020, when the Federal Reserve reduced the Fed’s fund rate between zero and 25 basis points (¼%).

According to the CME’s FedWatch tool, the probability that the Fed will raise interest rates from 0 – 25 basis points to 25 – 50 basis points is 98.3%. With a 1.7% probability that the rate hike will be more aggressive totaling ½ a percent hike to 50 – 75 basis points. However, it is widely believed that a ¼% rate hike has been, for the most part, factored into the current pricing of both precious metals and U.S. equities. U.S. equities continued their price decline as the first trading day of the week began.

With approximately 15 minutes remaining in the trading session, the Dow Jones Industrial Average is relatively unchanged, currently up nine points or 0.03% and fixed at 32,949.60. The NASDAQ composite does appear that it will close strongly lower as the tech-heavy index is currently down by 2.01%, a decline of 259 points and fixed at 12,584.99. The S&P 500 is also indicating that it will result in a decline today, currently trading off by 0.9%, which is a decline of 37 points, with the S&P currently fixed at 4166.92 points.

U.S. debt instruments are also trading lower, reflecting higher yields in anticipation of the Federal Reserve initiating liftoff or interest rate normalization. They almost certainly will announce an interest rate hike after this month’s FOMC meeting which begins tomorrow and concludes on Wednesday. The thirty-year U.S. government bond is currently yielding 2.47%, and the 10-year is currently yielding 2.13% after factoring in today’s drop in U.S. bonds and bills taking yields higher.

Unless there is some peaceful resolution to the Russian invasion of Ukraine, we can expect to see moderate to strong support of gold pricing even at these current levels, which reflect pricing that is near the top of the range resulting from the $300 rally which began in December of last year. Sadly, it does not appear that Russia in any way has de-escalated their attack even as they resumed negotiations via video links this morning.

While the goal of Ukraine continues to be securing a cease-fire leading to the immediate withdrawal of Russian troops from Ukraine, it appears that Russia is unbending, seeking that Ukraine surrender and its troops lay down its arms. With a divide between both sides so deep, it seems unlikely that a peaceful resolution to the conflict will be forthcoming in any short time.
 

By Gary Wagner

Contributing to kitco.com

Time to buy Gold and Silver on the dips

David

Gold, oil open lower

Gold, oil open lower

On Sunday open spot gold dropped $20 hitting $1,970 a ounce.

Oil was down, too, with Brent crude off 0.87% to $111.7 a barrel.

April gold futures last traded at $1,979.3 an ounce, down 0.29%.

Hong Kong's Hang Seng index opened lower, down 1.61% on Monday local time.

Major action in the Ukraine-Russia war over the weekend was a Ukrainian base near Poland getting hit by cruise missiles fired by Russia. Thirty-five people were killed, and 134 were wounded.
 

By Michael McCrae

For Kitco News

Time to buy Gold and Silver on the dips

David

What’s next for gold price after making a run for record highs? Fed, Ukraine updates on deck

What's next for gold price after making a run for record highs? Fed, Ukraine updates on deck

The Federal Reserve's interest rate decision and developments in Ukraine will dominate gold's price direction next week after the precious metal made a run for record highs.

Gold rallied on its safe-haven appeal this week as sanctions against Russia were stepped up to import bans and the war in Ukraine escalated, creating chaos in the commodities space. April Comex gold futures were last trading at $1,990.50 an ounce after briefly rising above $2,070 an ounce earlier in the week.

"Gold will continue to hover around $2,000 in the short-term. If gold closes at $1,980 an ounce, then I am bullish. If gold rises to $2,010, then I am neutral," OANDA senior market analyst Edward Moya told Kitco News.

The trading range for gold remains pretty broad due to the current volatility in many financial markets. The two leading drivers will be the Federal Reserve's meeting on Wednesday and any new developments regarding sanctions against Russia and the war in Ukraine.

"Gold could trade over the next week between $1,960 and $2,050. It is looking at a pretty wide range given the sensitivity of the situation in Ukraine. And we have the Fed policy meeting, which could provide some big shifts as to how the U.S. central bank will address the inflation outlook and more importantly what will be the path of tightening going forward," Moya said.

Wednesday's afternoon announcement will be followed by Fed Chair Jerome Powell's press conference. All eyes will be on the new economic projections, the dot plot, and Powell's take on the "unintended consequences" of the conflict in Ukraine.

"Powell has to provide clarity. He needs to set market expectations. After this, we'll get a better sense if there could be a risk of a super-sized rate hike over the summer."

Markets are currently pricing in a 95.1% chance of a 25-basis-point hike next week. These expectations were further cemented by the recent inflation data, which showed the U.S. Consumer Price Index (CPI) rising to 7.9% in February, a new 40-year high. Also, Powell testified last week that he would be supporting a traditional 25-basis-point hike at the March meeting.

"Investors have done a U-turn in their assessment of what Russia's invasion of Ukraine will mean for U.S. monetary policy ahead. A brief flirtation with the idea that the war's economic costs would temper the rate hike path has been quickly reversed, with the February CPI data being a further reminder that inflation is breaking out in just about every major category of goods and services," said CIBC World Markets chief economist Avery Shenfeld.

Capital Economics is forecasting new projections to point to at least five interest rate hikes in 2021 and an additional four rate hikes in 2023. This would take the Fed Funds rate to between 2.25% and 2.50%.

"Fed Chair Jerome Powell may offer more details in his press conference about the Fed's plans for quantitative tightening (QT), but we don't expect QT to be launched until closer to the middle of this year," said Capital Economics chief North America economist Paul Ashworth.

'Commodities are better investment than gold' as inflation could hit 10%, says billionaire 'Bond King' Jeff Gundlach

What about gold's pullback after hitting $2,000?

Consolidation after rising above $2,000 an ounce is a good thing for gold, said RJO Futures senior market strategist Frank Cholly.

"A pullback correction is good. It is testing the strength of the market. Gold will continue to march higher to the $2,050 area. I don't think that a rate hike next week is going to hurt the market," Cholly told Kitco News. "Now that we have the big breakout, I remain bullish. The uptrend is still intact. And right now, it is a good buying opportunity."

Gold will easily get back to $2,050 an ounce level in the short-term, he added. Plus, the Fed is now unlikely to surprise with a 50-basis-point hike since it has signaled a more cautious approach when raising rates to avoid throwing the economy into a recession.

Cholly also does not see the war in Ukraine lasting for many months as many fear, which could potentially see gold return to $1,900.

"There will be some resolution sooner rather than later. This is not going at all how Putin planned," he said. "Possible that we have a pullback to $1,900. But even before February 24, when Russia invaded Ukraine, the gold market was starting to take on a bullish tone. Now that we've broken out and are above these levels, I don't think gold is going back down to $1,800."
 

Data to watch next week

Tuesday: PPI, NY State manufacturing index

Wednesday: Retail sales, Fed interest rate decision, Powell's press conference

Thursday: Building permits, housing starts, jobless claims, Philadelphia Fed manufacturing index, industrial production

Friday: Existing home sales
 

By Anna Golubova

For Kitco News

Time to buy Gold and Silver on the dips

David

Gold corrects after unsuccessfully challenging its record high

Gold corrects after unsuccessfully challenging its record high

On Tuesday, March 8, gold traded to an intraday high of $2078, roughly $10 below the all-time high of $2088, which was achieved in August 2020. The current decline in gold is the first real price decline since January when gold hit a low of approximately $1780. Until Tuesday of this week, what followed in February was a dynamic rally resulting in gold gaining approximately $300 when gold traded to $2078. On Wednesday, March 9, gold opened above Tuesday’s closing price of $2043 but closed dramatically lower, resulting in a price decline of $72. Tuesday’s strong decline resulted in gold losing 3.49% in value, the largest single-day loss in 2022.

As of 4:45 PM EST gold futures basis, the most active April Comex contract is currently fixed at $1990.20, a net decline of $10.30 or 0.51%. However, this decline can be largely attributed to dollar strength. Currently, the dollar is up by 0.63% and with the dollar index fixed at 99.12. While gold pricing is lower today it is completely the result of dollar strength and fractional buying of gold.

Currently, spot gold is fixed at $1988.60, a net decline of $8.60 on the day. The Kitco Gold Index shows that dollar strength resulted in gold declining $12.40, and fractional buying resulted in a gain of $3.80 resulting in the net change today of -$8.60.

This week’s price action marked the beginning of the first correction since the end of January. Currently, gold has declined approximately 0.382% from Tuesday’s intraday high at $2078 to today’s low of $1960. 0.382% is an important Fibonacci retracement number. A shallow price correction based on Fibonacci retracement levels will begin at 0.236%, followed by a decline of 0.382% with a strong correction retracing as much as 0.618%, or 0.78%. On a technical basis, these four Fibonacci retracement levels are the most important numbers to focus on. Technical traders use these levels to monitor possible support levels that could indicate a conclusion of a correction.

That being said, based on a study of three different moving averages (50-day, 100-day, and 200-day), gold is still in full bullish alignment. Market technicians use the 50-day, 100-day, and 200-day moving averages as a benchmark to determine its short-term, interim term, and long-term market sentiment. If the current pricing of a stock or commodity is above the 50-day moving average market technicians interpret the short-term market sentiment as bullish. The 100-day moving average is used to determine interim term market sentiment, and the 200-day moving average reveals long-term market sentiment. If the 50-day is above the 100-day and the 100-day above the 200-day, it is interpreted as a full bullish demeanor.

Chart number two is a daily candlestick chart of gold futures, clearly illustrating that gold is in full bullish alignment. The 50-day moving average is currently fixed at $1861.70, followed by the 100-day moving average at $1832.20 and the 200-day moving average fixed at $1816.10. Gold pricing went into full bullish alignment during the last week of February when the 100-day moving average crossed above the 200-day moving average. As gold pricing continues to rise, we can see that the three moving averages are in a period of divergence, which simply means that the price between each moving average is increasing.

Based on the two technical studies we discussed above, we can derive the following conclusion. First, on a technical basis, the low in gold futures has touched upon the 0.382% Fibonacci retracement level, which is an acceptable level if this current correction will unfold as a shallow correction, as seen in chart 1. It does not confirm that pricing will stabilize here, but it is an important level to watch if gold prices hold this level ($1964) or trade below it. Secondly, even with this week’s correction resulting in a 5.48% decline in pricing from Tuesday’s high to today’s low, the three moving averages are still in full bullish alignment, as seen in chart 2.

Lastly, while we could see a further price decline on a technical basis, this week’s price decline has not resulted in major chart damage but has resulted in a price correction from Tuesday’s intraday high.

By Gary Wagner

Contributing to kitco.com

Time to buy Gold and Silver on the dips

David

Gold, silver up on safe-haven buying as U.S. equities sell off

Gold, silver up on safe-haven buying as U.S. equities sell off

Gold and silver prices are are higher in midday U.S. trading Thursday, on more safe-haven demand amid risk aversion that is still keen in the marketplace. Global stock markets and the U.S. stock indexes are still on shaky ground amid the biggest geopolitical crisis in decades that appears to be worsening. Some hot U.S. inflation data today was also bullish for the metals markets. April gold futures were last up $21.50 at $2,009.70 and May Comex silver was last up $0.554 at $26.385 an ounce.

The U.S. data point of the day Thursday was the consumer price index report for February, which was up 7.9%, year-on-year. That number is hot, at a four-decade high, and continues to stoke inflation that threatens to derail global economic growth just as most countries are finally getting past the Covid pandemic.

Global stocks markets were mixed overnight, with European shares mostly down and Asian shares mostly up. The U.S. stock indexes are lower at midday. Some stock market bears are calling Wednesday’s U.S. rally a "dead-cat bounce" in a bear market. The U.S. stock indexes remain in near-term price downtrends on the daily charts. Risk aversion remains elevated amid the ongoing Russia-Ukraine war. Talks between the two warring nations have produced no positive results, including those held today.

              Gold prices could hold around $2,000 for the next two years – ABN AMRO

Meantime, in the Euro zone the European Central Bank made no major changes in ECB monetary policy, as expected.

The key outside markets see Nymex crude oil prices lower and trading around $106.00 a barrel. The U.S. dollar index is higher today. The benchmark U.S. 10-year Treasury note is presently yielding around 1.95%. U.S. Treasury yields are on the rise this week.

Technically, April gold futures bulls have the firm overall near-term technical advantage. Prices are in a five-week-old uptrend on the daily bar chart. Bulls' next upside price objective is to produce a close above solid resistance at the record high of $2,178.80. Bears' next near-term downside price objective is pushing futures prices below solid technical support at $1,950.00. First resistance is seen at today’s high of $2,015.10 and then at $2,025.00. First support is seen at $2,000.00 and then at today’s low of $1,975.00. Wyckoff's Market Rating: 8.5

May silver futures bulls have the solid overall near-term technical advantage. Prices are in a five-week-old uptrend on the daily chart. Silver bulls' next upside price objective is closing prices above solid technical resistance at this week’s high of $27.495 an ounce. The next downside price objective for the bears is closing prices below solid support at $24.00. First resistance is seen at $26.50 and then at $27.00. Next support is seen at this week’s low of $25.465 and then at $25.00. Wyckoff's Market Rating: 7.0.

May N.Y. copper closed up 885 points at 466.05 cents today. Prices closed nearer the session high today. Prices this week scored a bearish and huge "key reversal" down on the daily bar chart, which is one clue that a market top is in place. The copper bulls still have the overall near-term technical advantage. Copper bulls' next upside price objective is pushing and closing prices above solid technical resistance at 490.00 cents. The next downside price objective for the bears is closing prices below solid technical support at 444.00 cents. First resistance is seen at 470.00 cents and then at 475.00 cents. First support is seen at this week’s low of 455.30 cents and then at 450.00 cents. Wyckoff's Market Rating: 6.5.

By Jim Wyckoff

For Kitco News

Time to buy Gold and Silver on the dips

David

Is the long-term upside move in gold over?

Is the long-term upside move in gold over?

Today was an absolute game-changer. Given that the recent ascent in gold to just under the record high of $2088 was absolutely news and headline-driven, changes in those headlines will have a dramatic and profound impact on the direction and price gains or losses in gold.

The President of Ukraine, Volodymyr Zelensky, said he is open to a compromise with Russia. That single statement had a profound impact on multiple asset classes. It resulted in U.S. equities having a strong rally with the Dow Jones industrial average gaining 653 points or 2%. The NASDAQ composite gained 3.58%, and the S&P 500 had a net gain of 2.57%.

Crude oil tumbled over 15% after reaching a 14-year high yesterday. Crude oil futures lost $14.17 today, a decline of 11.46%, and are currently fixed at $109.53 per barrel.

The safe-haven assets such as gold and the dollar also sustained strong price declines. The dollar lost 1.12%, and the dollar index is currently fixed at 97.97. Gold sustained a strong selloff and as of 5:15 PM EST, the most active August futures contract has declined by $47.60, or 2.33%, and is currently fixed at $1995.70. Silver lost 3.1%, and after factoring in today's price decline of $0.84, it is currently fixed at $26.06.

In an exclusive interview by the German newspaper "Bild," the Ukrainian President acknowledged that he is open to a compromise to end the war between Russia and Ukraine.

In this interview, President Volodymyr Zelensky said, "The question here is not what I can give. In every negotiation, my goal is to end the war with Russia. And I'm also ready to take certain steps. Compromises can be made, but they must not be a betrayal of my country. And the other side must also be willing to make compromises – that's why they're called compromises. This is the only way we can get out of this situation. We can't talk about the details yet."

It was this interview that caused many markets to pivot from bullish to bearish, as seen in gold, the dollar, and crude oil. It also caused U.S. equities to pivot from bearish to bullish.

So, the question becomes in the case of gold, "has the rally in gold concluded?" The short-term answer is that it is very likely that we will see gold continue to drop in price as long as there is hope that a peaceful resolution can be accomplished through negotiations between Russia and Ukraine. However, the long-term answer is quite different.

This is because the recent climb in gold pricing was based on the geopolitical tension caused by the crisis in Ukraine as well as inflationary pressures at a 40-year high with the CPI for January currently at 7.5% when compared to a year earlier. Tomorrow the government will release its most current CPI index data and currently, analysts polled by various news organizations predict inflation will rise from 7.5% to 7.9% year-over-year. With the recent rise in crude oil pricing and food, there is almost no possibility or scenario in which inflationary pressures have declined from January to February.

Gold has moved on two major issues, the war in Ukraine and spiraling inflation. Higher inflation levels would be highly supportive of gold and make it likely that after this correction, it will return to rally mode and exceed the record high of $2088 achieved in August of 2020.
 

By Gary Wagner

Contributing to kitco.com

Time to buy Gold and Silver on the dips

David

Gold challenges record high but declines after hitting a high of $2078.80

Gold challenges record high but declines after hitting a high of $2078.80

Today gold spiked with a massive gain of $82, taking gold futures within $10 of the record high at $2088, which occurred in August 2020. Just as quickly as gold rose dramatically higher profit-taking and a recovery of U.S. equities resulted in gold trading off of the highs giving up over half of the gains from the intraday high. New York's trading session just ended, and as of 1:30 PM EST, April futures are currently fixed at $2050, a net increase of $55 on the day.

We are witnessing extremely fast market conditions and it will be interesting to see how gold trades after the half-hour break, at which time (2:00 PM EST) Globex trading will begin remaining open until 8:00 AM EST.

Gold's massive gains today are a continuation of investors' flight to safety, incorporating gold as the go-to safe-haven asset. Today's gains occurred with moderate tailwinds from dollar weakness which added to the dynamic gain.

Geopolitical tensions continue to grow as the Russian invasion of Ukraine continues to escalate. The Russian army is now disrupting routes that have been used for civilians fleeing through “humanitarian corridors."

Now in its 11th day since the onset of the invasion, Russia's military continues to struggle to capture major cities and incur losses of aircraft and armored vehicles. This has hardened Vladimir Putin's resolve, resulting in the use of missiles and rocket strikes rather than using their 150,000 troops. After three rounds of negotiations, the only achievement was an agreement to continue to negotiate in an attempt to reach a cease-fire.

Another major factor fueling gold pricing higher is the current level of inflation with the CPI index up 7.5% year-over-year in January. The current level of inflation at a 40-year high most likely will continue higher based upon rising prices of both oil and food. Crude oil continues its historical rise today, gaining just over $3 and is currently fixed at $122.77 per barrel.

Food costs have also been rising globally. As oil rises so does the cost of producing and transporting food from farm to table. Europe is witnessing even greater increases in food costs as Ukraine exports a large portion of its agricultural products. Ukraine's agricultural exports to Europe have been dramatically affected by the current military action by Russia.

On Thursday, March 10, the U.S. government will release the latest data on the current level of inflation and based upon the dramatic rise in oil and higher food costs, it most certainly will increase from its current levels.

By Gary Wagner

Contributing to kitco.com

Time to buy Gold and Silver on the dips

David

Gold flirts with $2000 as U.S. equities continue to encounter a dramatic selloff

Gold flirts with $2000 as U.S. equities continue to encounter a dramatic selloff

Gold continues to gain value based upon rising inflation levels and the current crisis in Ukraine. The combination of geopolitical tensions and high levels of inflation are highly supportive of higher gold and silver pricing in the future. Also, major selling pressure resulting in lower prices in U.S. equities has market participants moving risk-on investment dollars into safe-haven assets.

As of 3:35 PM EST, with approximately 25 minutes left in the trading day, all three major indices are sharply lower. The NASDAQ composite is currently off by 3.21%, a decline of 427 points, with the index currently fixed at 12,886. The Standard & Poor’s 500 is down 2.64%, or 114 points, and is currently fixed at 4214.85. The Dow Jones industrial average has given up 2.18%, and after factoring in today’s decline of 716 points is fixed at 32,903.61. To effectively illustrate the massive decline in U.S. equities, consider that on February 9, the Dow closed at 35,751 points. In just under a month, the Dow has lost 7.96%.

The CPI (consumer price index) revealed that inflation has risen to a 40-year high in January, coming in at 7.5%. Unlike the PCE index (the preferred index used by the Federal Reserve), the CPI includes both energy and food costs. Therefore, it is a much more realistic barometer of current inflationary pressures. Because the price of crude oil has spiked tremendously, it is almost a certainty that the CPI index for February will reflect higher food and energy costs taking the inflation level well above 7.5%. The Bureau of Labor Statistics will release February’s CPI number this Thursday, March 10.

Crude oil futures continue their dramatic price increase. The most active crude light futures contract gained an additional 3.14%, or $3.63, and is now fixed at $119.42 per barrel. This will be reflected in rising gasoline prices that could now cost as high as five or six dollars per gallon in the United States.

In trading overseas last night, gold futures, basis the most active April 2022 contract peaked at $2007.50. After trading to a low of $1964.20, gold prices recovered and are currently fixed at exactly $2000 per ounce, which is a net gain of $33.40 or 1.70%. Gold seems to be forming a base above $2,000.

The current level of inflation coupled with the crisis in Ukraine will continue to be highly supportive of gold and take the precious yellow metal yet to higher prices. Inflationary pressures continue to get hotter and the conflict in Ukraine continues to escalate which most certainly will continue to support higher pricing for gold. Now that gold is trading right around $2000, it is highly likely that $2,000 will become a new level of support.

Our technical studies indicate that current resistance levels begin at $2000, which should become support. The next level above that price point is $2022 and is based upon a price top that occurred at the end of September 2020. The next level of resistance above $2022 occurs at $2059, also based upon a top that occurred one week after gold achieved its record high of $2088. The brass ring so to speak, or the highest level of resistance that gold could easily take out during this leg of the rally is the record high at $2088.

Since that is the highest level that gold has traded to resistance levels above that require a different type of analysis, we have found that the combination of Elliott wave coupled with Fibonacci extensions provides the greatest insight to plot resistance above the record high. However, we are still $88 from that price point and will use the levels we have spoken about as the key levels of resistance should gold continue to rise.
 

By Gary Wagner

Contributing to kitco.com

Time to buy Gold and Silver on the dips


David