Bitcoin (BTC) Price Analysis – Short-Term Bullish Signals
Bitcoin has formed a double bottom and bullish flag on the 1-hour chart.
BITCOIN PRICE ANALYSIS
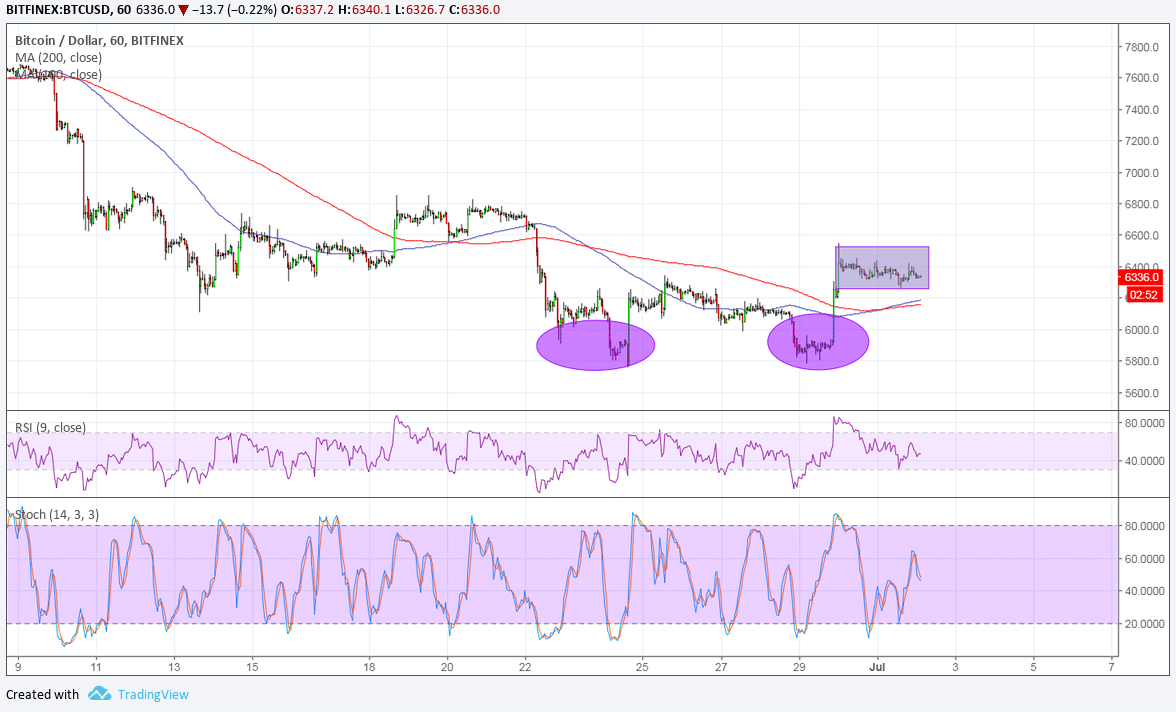
Bitcoin could be done with its slide as price formed a double bottom on the 1-hour time frame. Price also seems to have broken past the neckline around $6,400 to confirm that a reversal is underway.
Price is consolidating inside a bullish flag for now, though, but this is often considered a continuation signal. The mast of the flag spans $5,800 to $6,500 so the resulting climb could be of the same height. This would also be roughly the same size as the double bottom reversal formation.
The 100 SMA is crossing above the longer-term 200 SMA to signal that the path of least resistance is to the upside. In other words, the rally is more likely to gain traction than to retreat from here. Price has moved past the moving averages to indicate a pickup in buying pressure as well.
RSI appears to be on the move down, though, so some selling pressure could return. Stochastic is also hesitating on its climb so bitcoin could follow suit. In that case, a quick pullback to the moving averages’ dynamic inflection points around $6,200 could ensue before more bulls join in.

Bitcoin is off to a positive start so far this month and quarter, reviving investor confidence that the cryptocurrency could end up positive for the year. A co-founder of a bitcoin exchange even noted that we’ve seen these price dips before and that bitcoin is on track to reach $50,000 by the end of the year.
BitMEX co-founder Arthur Hayes cited:
“We could definitely find a bottom in the $3,000 to $5,000 range. But we’re one positive regulatory decision away, many an ETF approved by the SEC, to climbing through $20,000 and even to $50,000 by the end of the year.”
He also added that the time between a bear market and bull market could shorten, given how more people are talking about bitcoin thanks to its increased visibility.
By Rachel Lee On Jul 2, 2018
David