Building for Bulls, Bears, and the Crypto Revolution
Last year, I ended my 2017 Year in Review piece with the following statement:
“Those who change the world don’t always set out to do so. All it takes is a decision to do something today, do it better tomorrow, and to not stop doing it…ever. One day, you’ll lean back, zoom out and realize the peaks and valleys that have consumed you were just the runway and the real lift-off has yet to occur.”
It seems fitting to start my review this year with the same statement and observe how its meaning kaleidoscopes in the new light of 2018.
For context, in December 2017, the price of bitcoin had just hit its all-time high of $19,783.06. The price of ether was about to hit its all-time high of $1,417.38. CryptoKitties were running rampant all over the ethereum network, thousands of ICOs had launched in 2017 and hundreds of dedicated crypto funds opened their doors.
Today, the environment is a bit different. Those crypto funds are starting to shut down. ICOs that raised capital in crypto in 2017 have seen their runways halved and halved again. The price of bitcoin hovers around $3,500 and the price of ether plummeted below $100. CryptoKitties has a meagre 378 daily active users, down from over 15,000 daily active users this time last year. Ouch.
What I failed to mention with last year’s statement is that the runway isn’t always smooth and it isn’t going to be at a constant incline.
As Meltem Demirors so gracefully put it, “Tech that changes industries and markets doesn’t get built overnight. There are fits, starts, and failures.” Obviously, this market is throwing a fit. Furthermore, us builders should talk about it.
But Builders Don’t Talk About Price
For as long as I can remember, it’s been a significant taboo for builders in the space to talk about price. The market conditions shouldn’t affect our attitudes or how we build. We actively avoid getting caught in the hype on the way up and avoid falling into depression on the way down.
We transformed “HODL” into “BUIDL,” and there was also short-lived talk of “SHIPL.”
However, refusing to engage in “price talk” doesn’t mean we can, or should, ignore the swings of the market. This ecosystem is highly speculative and our roadmaps, runways and design choices are affected by larger macroeconomic conditions. Denying that the market conditions affect your work, company, financials, and culture is willful ignorance and is dangerous in the short and long term.
2017: Unprecedented Hype
As we saw in 2017, the bull market garnered previously-unseen hype, which led to new, inexperienced users entering the space en masse. Coinbase was adding hundreds of thousands of new users per day. Companies were hiring support teams by the dozens in an attempt to tread overflowing inboxes.
The things we did in 2017 were reactionary. Building for the short term was prioritized over the long term.
We didn’t have refined processes or roadmaps — we had fires that needed to be put out yesterday. We hired those who were willing to wear many hats and didn’t require much sleep. We put band-aids on the most glaring user experience issues as they cropped up, and we promised to iterate later. The market’s ambitious upswing wasn’t tied to the technology and experience being delivered.
2018: The Downward Spiral
2018 was a whole new world. The number of support tickets dropped as fewer new users entered the space. The types of questions we fielded about ICOs plummeted and more technical questions emerged once again.
The members of my team who were solely fueled by the adrenaline of 2017 had to evolve or move on to different projects. Some even left the crypto-space entirely. Our hiring and recruiting practices evolved, and the skills and personality traits we looked for became more refined.
The actions users are taking in 2018 have changed as well.
Whether it was taxes, the SEC, a more bearish market or the realization that the scope of blockchain use cases is still limited, people aren’t doing much these days. Even when we look beyond the trading and investment activity via DappRadar and Dapp.com, we can see just how little activity is happening.
The market is questioning how “decentralized” applies to a world beyond us cypherpunks and early adopters. It’s a valid question that us builders should ask too.
2019: Blood in the Streets?
To steal from Anthony Pompliano (who likely stole it from someone else), there is no “blood in the streets” yet. The blood is coming, but it isn’t only from the individuals who have portfolios that are down more than 100 percent.
It is from anyone and everyone who failed to anticipate just how long this revolution would take. It is from people who didn’t believe in the possibility of a market crash or a long winter. It is the ICOs that had all their holdings in crypto. It’s from those who measure growth and value in terms of months, not years or decades.
More robust companies can reduce the sizes of their teams and cease throwing extravagant parties to lengthen their runways.
Less seasoned companies will have no choice but to shut down. And the most important companies are likely the ones you haven’t yet heard of or are yet to be created.
2019 & Beyond
The coming years have the potential for people to create real, revolutionary value. This will not be the short-term capital creation that ICOs brought in 2017. It will be significantly deeper, take significantly longer and it will spawn from unlikely sources.
Reacting to new users and irrational exuberance is a different ball game than building products that break down the barriers of cryptocurrencies. In order to be relevant and stay relevant, you have to do more.
Those that will have a lasting impact and create the most value will be those who can build for both the bull market, the bear market and beyond the market. They will have the foresight to expect the unexpected, the hindsight to learn from the past and the insight to solve problems in unprecedented ways.
They will use their teams, tools, knowledge and communities to not only build for the next wave of users, but also help bring in the next wave of users. They will not build “on the blockchain” or “for the blockchain.” They will build better solutions that happen to utilize the blockchain.
It’s easier to build products for your existing environment and existing users, but it is shortsighted and will leave you straggling in the long term. Look outside this space for inspiration. Learn from traditional companies who have been around for decades or even centuries. Take the time to understand the motivations and needs of people around the globe. Don’t make product decisions based on the graveyard of activity today. Don’t create personas based on a Twitter poll you spun up yesterday.
Look to the future and anticipate. Your job is no longer to react to the current conditions. It’s to be a fortune teller of tomorrow’s landscape.
Sparking the Revolution
Many point to the dot-com bubble when analysing the cryptocurrency markets in 2017.
Both saw 1,000 percent returns, rampant day-trading, fraud, capital flowing to any company with “.com” or “blockchain” in its name, and the creation of overnight millionaires even when those millionaires had neither delivered products nor profits. It’s an easy comparison. But it’s only one slice of history.
The repetition of history won’t manifest as a carbon copy of itself, so it’s hard to know exactly how this decentralized revolution will play out in totality. The revolution will be simultaneously subtle and profound. What we are building cannot be measured in months or judged by the hype cycles. We are aiming to transform nearly every industry that exists, starting with the financial industry.
The blockchain has come a long way since Satoshi’s white paper and it will take at least that long to disrupt life in a meaningful way.
We have to keep zooming out to keep our perspective wide. The dot-com bubble isn’t what transformed the internet, nor will the last two years be what transforms the blockchain. We need to look at the entire history of the internet and watch how it evolved over time. We need to examine how the Industrial Revolution managed to touch almost every aspect of daily life. We need to remember The Renaissance’s lasting influence on intellectual inquiry.
And, as we do, we should be intimidated by what we have yet to accomplish and inspired by the opportunity to forge the runway ahead. Remember, the real lift off has yet to occur.
Have a strong take on 2018?
Taylor Monahan
Dec 27, 2018 at 05:00 UTC
David


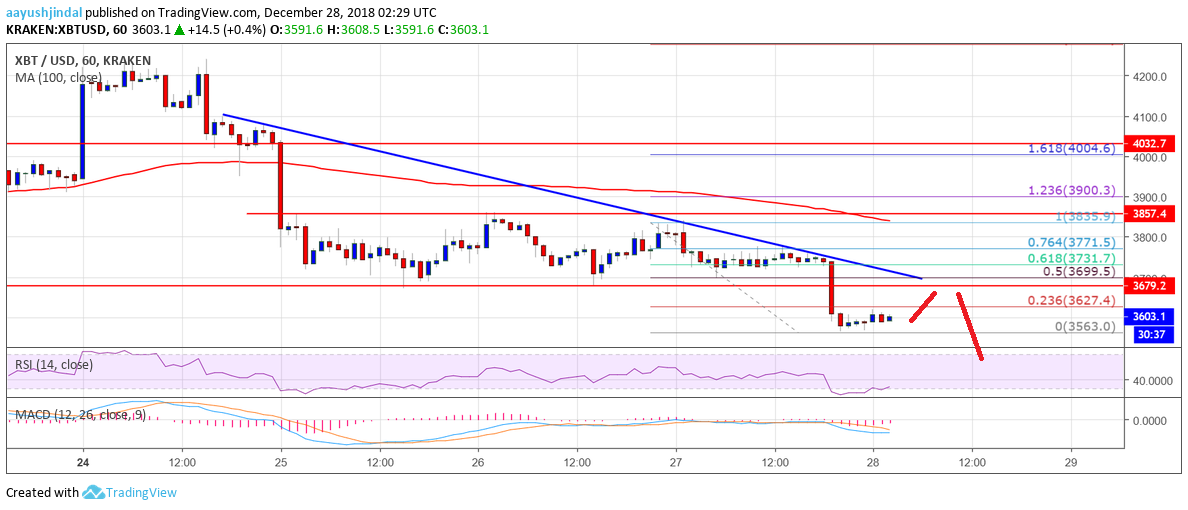
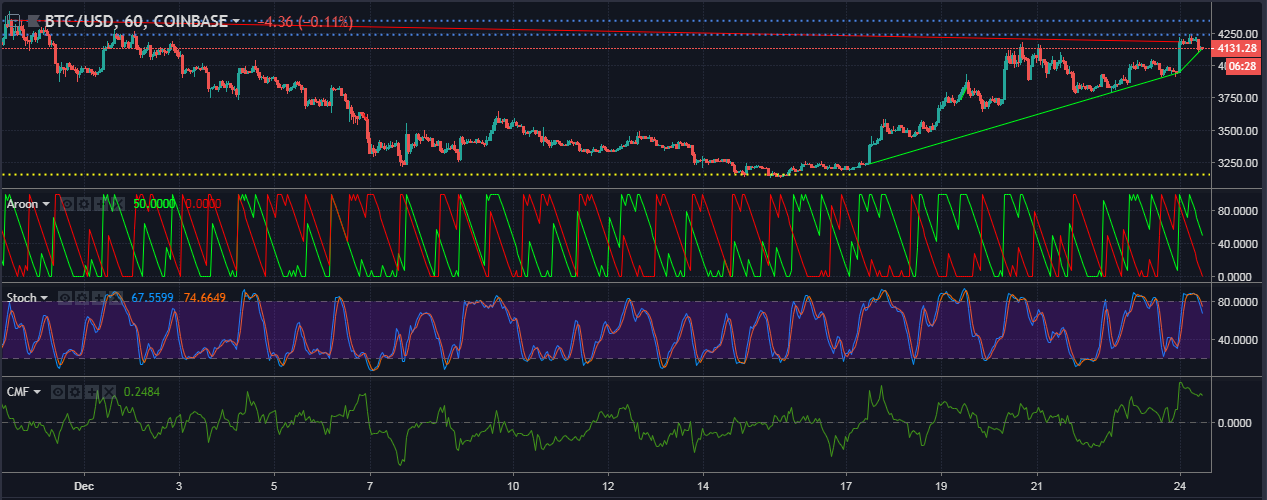
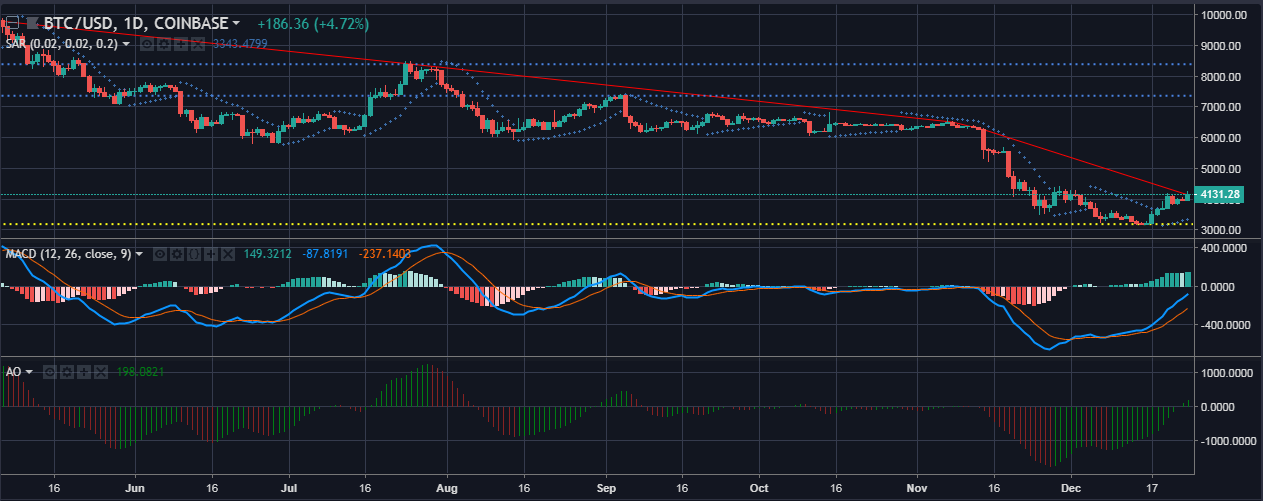
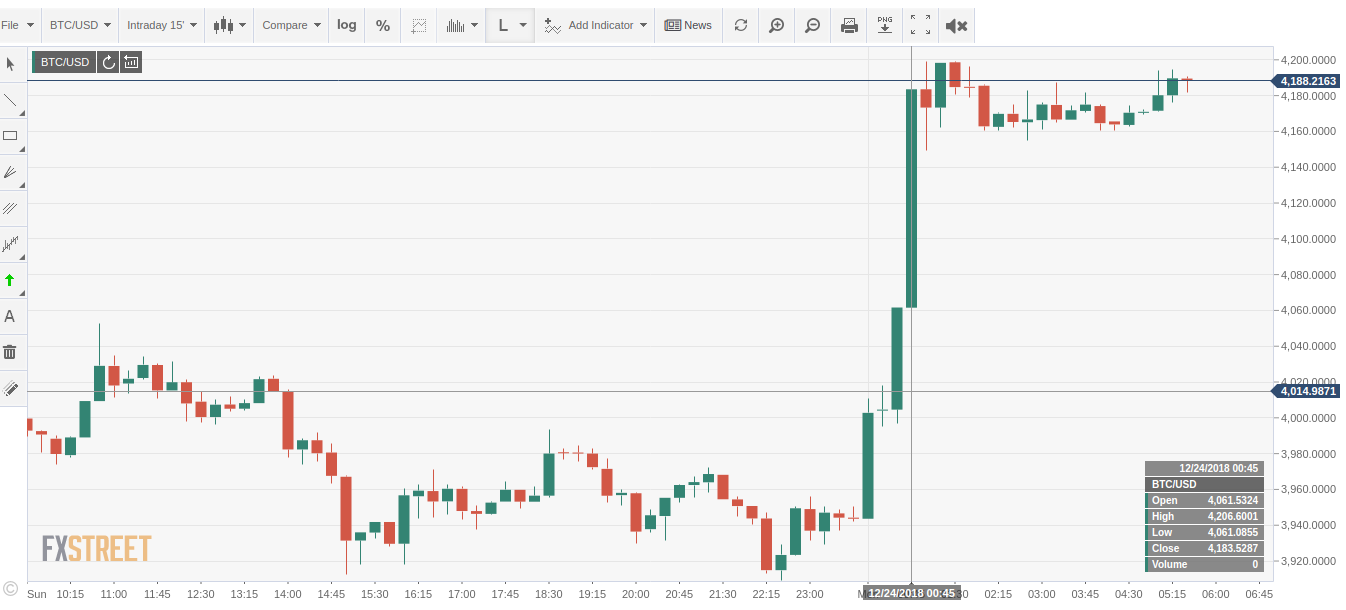
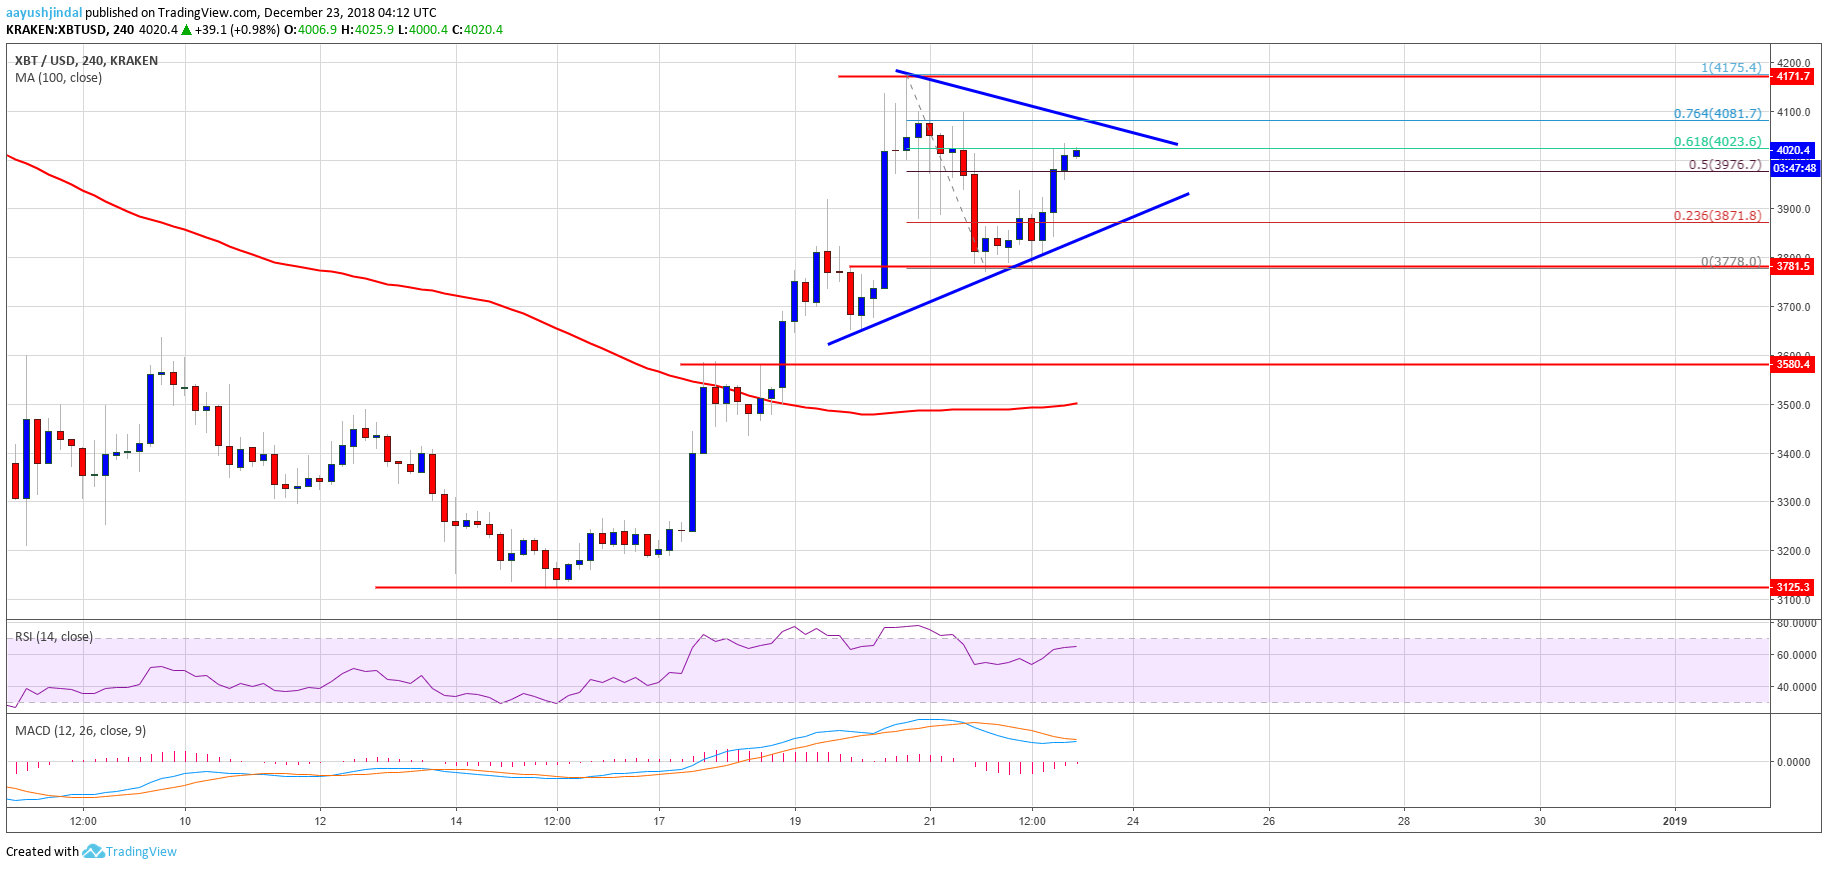
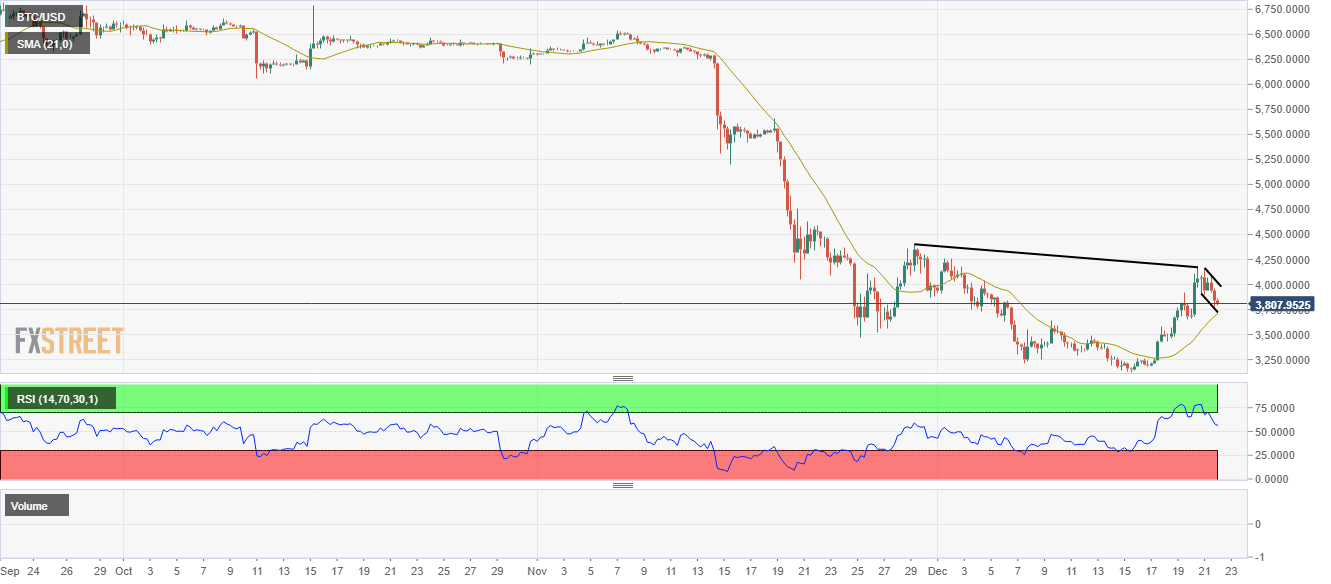
![Bitcoin [BTC/USD] Technical Analysis -Prices climb up as the bulls are back in town](http://seriouswealth.net/wp/wp-content/uploads/2018/12/Untitled-4.png)