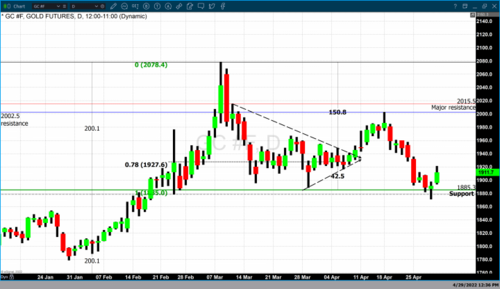
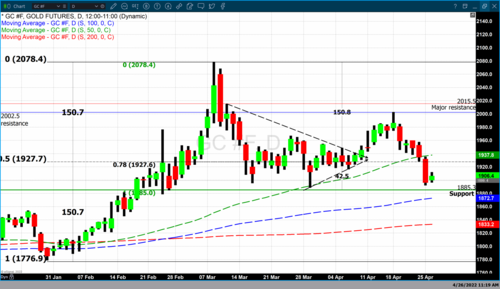
Gold bounces off yesterday’s lows but is unable on to hold today’s highs
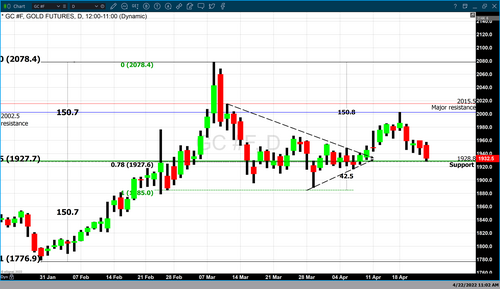
June 2022 gold futures opened this morning (4/29/2022) at $1895.80, far above yesterday’s low of $1871. Trading to a high of $1921.30 and settled in New York up 1.1% at $1911.70. However, on Fridays, Globex trading remains open until 6 PM EDT before closing for the weekend. As of 5:10 EDT gold has moved back below $1900 and is currently fixed at $1896.90 a net gain of $5.60 or 0.30% in afterhours trading.

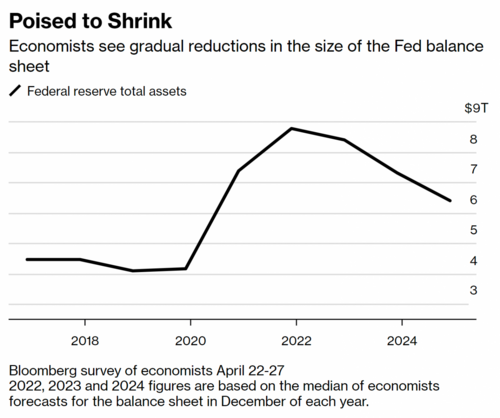
The tremendous price swings evident in gold over the last couple of days likely resulted from multiple factors influencing gold prices. Investors continue to focus on next week’s FOMC meeting. It is widely anticipated that they will enact a ½ a percent interest rate hike which will go into effect at the end of next week’s meeting. Concurrently it is widely believed that the Federal Reserve will begin to reduce its balance sheet assets over the next three years. Economists polled by Bloomberg news believe that the Federal Reserve will reduce its balance sheet from the current level of $8.8 trillion to $6.4 trillion by the conclusion of 2024.
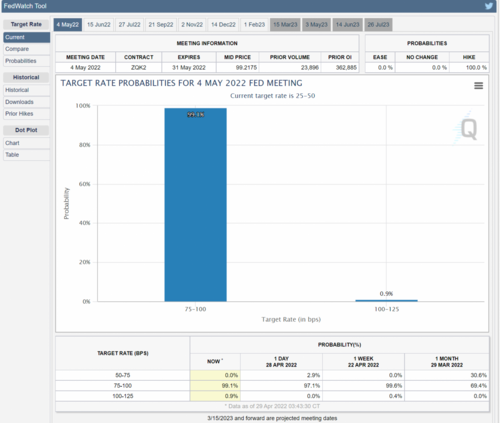
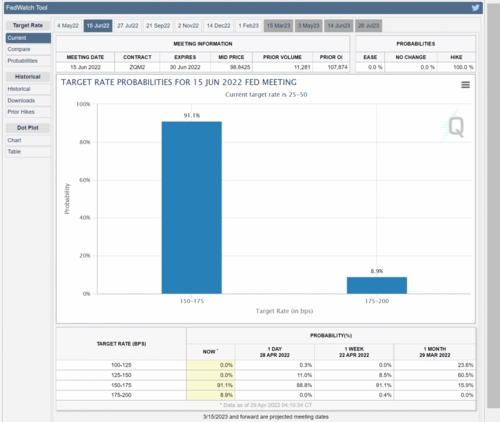
According to the CME’s FedWatch tool, there is a 99.1% probability that the Federal Reserve will announce ½ a percent rate hike. This indicator predicts a 91.9% probability that another half a percent rate hike will follow next week’s rate hike at the June FOMC meeting. The speed at which the Federal Reserve will raise interest rates in an attempt to play catch-up to the spiraling level of inflation provides bearish market sentiment for gold.
Today’s release by the Bureau of Labor Statistics of the PCE report indicated that inflation continues to surge higher. The PCE (Personal Consumption Expenditure) index was up 0.9% on the month and 6.6% on the year a 42-year high. This is the highest level since 1980. Yesterday’s the BEA released advance estimates for first-quarter GDP. The U.S. economy had a major contraction during the first three months of this year due to a resurgence in Covid 19 and a decline in government stimulus. This is the first decrease in U.S. GDP in approximately two years.
These two reports will certainly lead to bullish market sentiment for gold.
Additionally, there is a major economic fallout from the ongoing war in Ukraine. Inflation globally has been pressured higher especially in food costs because both Russia and Ukraine are major exporters of grains such as corn and wheat. Russia also is a primary provider of energy products such as oil and natural gas. Russia is the 3rd largest producer of oil. This continues to support higher pricing for oil and natural gas.
Since the largest components of spiraling inflation are energy and food costs, the war in Ukraine had a significant impact on moving inflation higher.
Unquestionably, there are multiple factors and events which have influenced gold prices. The complexity of all of these components we have spoken about today are providing both bullish and bearish undertones for the safe-haven asset gold, and in fact, might be the primary cause of recent price volatility.
By Gary Wagner
Contributing to kitco.com
Time to buy Gold and Silver on the dips
David

 Major Russian gold miner opts for exports versus imports as local banks buy gold at discount
.gif)
.gif)


.gif)
.gif)


 The Fed's 'Ponzi Scheme' is crushing the middle class, this may be the only way out – Natalie Brunell
.gif)
.gif)
.gif)
.gif)