Bitcoin (BTC) Price Analysis – Next Potential Ceilings
Bitcoin previously broke below a symmetrical triangle and might be due for a retest.
BITCOIN PRICE ANALYSIS
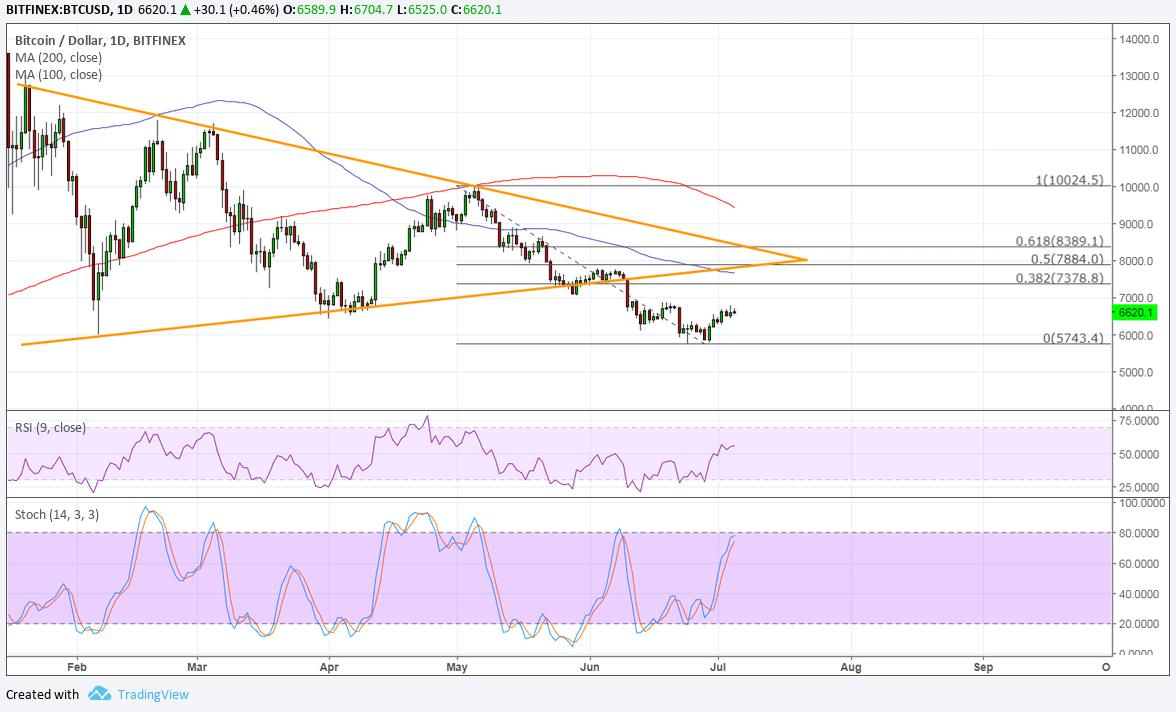
Bitcoin was moving south since breaking below the bottom of a long-term symmetrical triangle. Price has been climbing recently and might be due for a pullback to the former support area.
Applying the Fibonacci retracement tool on the latest swing low and high shows that the 50% level lines up with the broken triangle support. This is also close to the 100 SMA dynamic inflection point.
On the subject of moving averages, the 100 SMA is safely below the longer-term 200 SMA to confirm that the path of least resistance is to the downside. In other words, the selloff is more likely to resume than to reverse.
RSI is still heading north so bitcoin could follow suit until the oscillator reaches overbought conditions and turns lower. Stochastic is closer to the overbought region and might reflect bullish exhaustion soon. In that case, the 38.2% Fib might already be enough to keep gains in check and push bitcoin back to the swing low.
A larger correction, on the other hand, could find its way up to the 61.8% Fib at $8,400. A move past that area and the 200 SMA could be enough to confirm that bulls have the upper hand.

Bitcoin is holding on to its positive start this quarter, although many still have doubts that the rallies could be sustained. For one, this could be a much-needed relief rally from the earlier decline and investors are simply holding out for the next set of catalysts.
In the meantime, the spotlight could shift to the US dollar as the FOMC will release the minutes of its latest meeting ahead of the NFP report. Hawkish expectations could drive the dollar higher across the board while downbeat data could leave bitcoin poised to take advantage.
Apart from that, any headlines pertaining to stricter regulation or another security incident on an exchange could revive the declines in bitcoin.
By Rachel Lee On Jul 5, 2018
David