The only silver lining is the gold-silver ratio
When we look at the precious metals complex the only thing we see moving higher is not a specific precious metal, rather it is a ratio between two precious metals. This ratio is the only investment that is competing with recent dollar strength which hit a new high today of 101.26, after factoring in today’s gain of approximately 1 ½%.
The only silver lining to this cloud of coronavirus confusion and fear is the gold-silver ratio. The historical I use only goes back to 1998. That being said, the current gold -silver ratio is the highest on record.
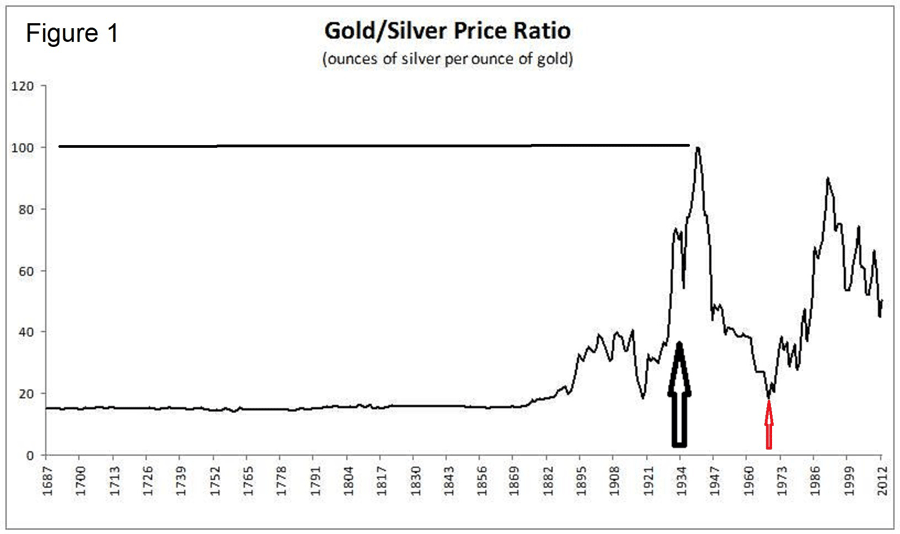
Historically speaking from 1687 up until 1885 the gold-silver ratio was fixed at just under 20 to 1, meaning it took 20 ounces of silver to equal the value of 1 ounce of gold. Between 1885 and 1934 the ratio remained range bound between 20 to 1, and 40 to 1.
Figure 1 is a long- term chart of the gold- silver ratio, it goes back to 1687. The arrow just under 1934 shows the dramatic change in the ratio following legislation by President Roosevelt.

President Franklin Roosevelt enacted legislation and passed the Gold Reserve Act of 1934. This act made it illegal for American citizens AND the Federal Reserve to own gold. This act required that all Americans and the Federal Reserve to surrender all of their gold coins as well as gold certificates to the United States Department of the Treasury and exchange them for new American dollars which no longer were redeemable in gold. This in essence converted the gold standard-based dollar to a partially backed currency.
Citizens as well as the Federal Reserve Bank transferred all of their gold reserves to the U.S. treasury at a discount. The net result was that the United States had established an exchange stabilization fund under the control of the treasury which would control the value of the dollar.
After World War II many major countries all met in Bretton Woods and created a monetary management system to maintain the external exchange rate which effectively allowed countries to convert their U.S. dollars to gold.
From 1934 to 1947 the gold-silver ratio rose to 100 for a brief period before settling back to its former level of 20 to 1 in 1971. The red arrow on figure 1 represents the year, 1971 that President Nixon passed legislation that in essence abolished the gold standard as we know it. This became known as the Nixon shock which effectively ended the Bretton Woods agreement and abolished the ability for countries to convert their U.S. dollars into gold.
This caused the gold silver ratio to rise once again to approximately 80 to 1.
Figure 2 is the gold silver ratio from 1975 to 2015. It shows that between 1990 and 2015 the gold silver ratio traded from 90 to 1, to as low as 35 to 1.

However, that all changed at the beginning of 2020, when the ratio had been trading at roughly 85 to 1. Figure 3 is the gold silver ratio including the most current data up until March 18, 2020. During the first 18 days of March the gold silver ratio jumped from approximately 95 to the current value today of 124, the highest level on record.
What is clear is that the precious metals as a group have been under pressure and trading dramatically lower ever since the coronavirus crisis began. However never in history has it taken 124 ounces of silver to equal the value of a single ounce of gold, until today.

Wishing you as always good trading,
By Gary Wagner
Contributing to kitco.com
David