Potential short-term bottom identified by a two-day candlestick pattern

Potential short-term bottom identified by a two-day candlestick pattern

While it is a little too early to say that the price correction in gold which began on the 23rd of last month is over, the first signs of a potential bottom have appeared today. Gold pricing did recover this morning, however at the same time, gold traded to the lowest intraday price of $1676 since the intraday low of $1666.50 seen on April 21st.

If this low achieved today holds throughout next week, and gold pricing trades higher we will witness gold trading to a higher low than the previous low. The key will be whether or not gold pricing can move above its most recent high of $1754 achieved on April 23rd.

We have also identified a simple two-day candlestick pattern that can indicate a pivot, or market called a piercing line. This pattern is a two-day candlestick pattern that occurs after the market has been in a defined downtrend. The first day of this pattern begins with a large red candle, which is created when a stock or commodity closes well below its opening price.

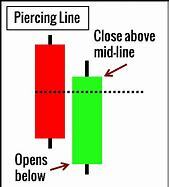
The following candle will be composed of a green candle, which is created when a stock or commodity closes well above its opening price. If it also opens below the close of the prior session this creates a price gap between the real body of the previous red candle. The green candle then must close at or above the midpoint of the prior days red candle. Lastly to take the signal one should wait for confirmation which means that the following day is a green candle with a higher high, and higher low than the previous green candle (the bigger the confirming candle the stronger the signal).

Silver traded higher today gaining almost seven cents on the day, with the most active May contract currently fixed at $15.04. The key distinction is that silver is trading below its 21-day exponential moving average and its 50-day moving average. While gold and silver tend to move in tandem, it is quite possible that if we see lower equity prices next week silver will continue to be pressured by its industrial component, rather than act as a safe haven asset.

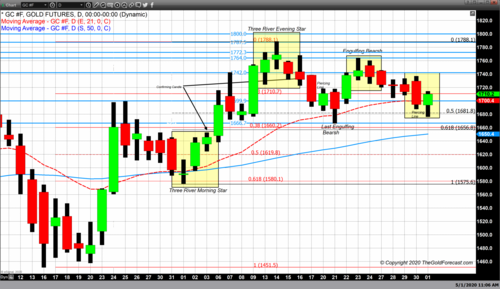
Gold futures basis the most active contract month (June) closed up by a little over $14 today. As of 4:30 PM EDT gold futures are fixed at $1708.40, which is a net gain of $14.20 on the day. Today’s close is just off the intraday high of $1714.40. Gold never traded below its 50-day moving average. However, yesterday’s decline, as well as today’s opening price were below the 21-day exponential moving average which is currently fixed at $1700.40. Today’s $14 gain put pricing well above that average.

Our technical studies indicate that there is minor resistance at $1710.70, which is the 23% Fibonacci retracement, with the next level of resistance at $1764 which is the high that occurred on the 23rd of last month. With major resistance at $1788, which remains the highest value gold has obtained this year.

Wishing you as always good trading and good health,

By Gary Wagner

David

Gold solidly down Thursday, following sell off in U.S. equities

Gold solidly down Thursday, following sell off in U.S. equities

Gold prices are posting solid losses in midday U.S. trading Thursday and were near daily lows, following the U.S. stock indexes lower as they also extended daily losses. Bullish outside markets today–a lower U.S. dollar index and sharply higher crude oil prices—offered no support to the precious metals. Some more profit taking in gold and silver from the shorter-term futures traders is featured today. June gold futures were last down $18.00 an ounce at $1,696.50. May Comex silver prices were last down $0.18 at $14.98 an ounce.

Thursday’s weekly jobless claims report, which has become the focal point of the marketplace in recent weeks, showed a rise of 3.84 million in new claims. The number was forecast to be 3.5 million. The report is a reminder of the dour state of the U.S. economy. The U.S. stock market lost its overnight gains after the release of this report.

Global stock markets were mostly firmer in overnight trading. Some upbeat news Wednesday on a drug trial that lessens the effects of Covid-19 and a big rebound in crude oil prices prompted some better trader and investor risk appetite as April winds down. Many U.S. states are now partially reopening their businesses.

In other news, the European Central Bank left its monetary policy unchanged at its regular meeting Thursday. However, the ECB also painted a very bleak picture for the Euro zone economy. The Euro zone gross domestic product contracted by 3.8% in the first quarter from the fourth quarter of 2019, and was down 14.4%, year-on-year, it was reported overnight. Those numbers are a record for the 14-nation bloc. The year-on-year decline in Euro zone GDP was much greater than the 4.8% drop in U.S. GDP in the same period, and reported on Wednesday.

A Reuters (Refinitiv) survey just released shows global jewelry fabrication volumes, which typically account for around 55% of total physical demand for gold, fell 40% in the first quarter, year-on-year. Investment demand was mixed, with retail investment, which consists of bars and coins, posting an 11% year-on-year drop. Physical gold demand fell to 753 metric tons in the first quarter, the lowest levels since 2009 as higher gold prices led to a drop in consumption. The biggest declines were recorded in Asia at down over 43% year-on-year. Chinese demand recorded a 62% decline in jewelry fabrication in the period.

The important outside markets see Nymex crude oil again solidly higher and trading around $17.50 a barrel. The U.S. dollar index is solidly lower today. The greenback bulls are fading fast this week, partly on notions other major countries’ economies are coming back to life faster than that of the U.S. The 10-year U.S. Treasury note yield is trading around 0.6% today.

Technically, June gold futures scored a bearish “outside day” down on the daily bar chart today. The bulls still have the firm overall near-term technical advantage amid a six-week-old price uptrend still in place on the daily bar chart. Gold bulls' next upside near-term price objective is to produce a close above solid technical resistance at the April high of $1,788.80. Bears' next near-term downside price objective is pushing prices below solid technical support at last week’s low of $1,666.20. First resistance is seen at $1707.80 and then at $1,725.00. First support is seen at today’s week’s low of $1,687.50 and then at 1,675.00. Wyckoff's Market Rating: 7.0

May silver futures also scored a bearish “outside day” down on the daily bar chart today. The silver bulls have the slight overall near-term technical advantage. However, a four-week-old uptrend on the daily bar chart has stalled out. Silver bulls’ next upside price objective is closing prices above solid technical resistance at the April high of $16.30 an ounce. The next downside price breakout objective for the bears is closing prices below solid support at $14.00. First resistance is seen at $15.25 and then at $15.50. Next support is seen at today’s low of $14.795 and then at $14.56. Wyckoff's Market Rating: 5.5.

May N.Y. copper closed down 285 points at 234.60 cents today. Prices closed near the session low today on profit taking after hitting a six-week high early on. The copper bulls still have the overall near-term technical advantage. Prices are in a five-week-old uptrend on the daily bar chart. Copper bulls' next upside price objective is pushing and closing prices above solid technical resistance at 250.00 cents. The next downside price objective for the bears is closing prices below solid technical support at last week’s low of 214.95 cents. First resistance is seen at today’s high of 240.80 cents and then at 243.00 cents. First support is seen at Wednesday’s low of 233.40 cents and then at 230.00 cents. Wyckoff's Market Rating: 6.0.


By Jim Wyckoff


David