Bitcoin (BTC) Price Analysis – Down To The Last Line Of Defense
Bitcoin staged another sharp selloff and might be testing the line in the sand for support.
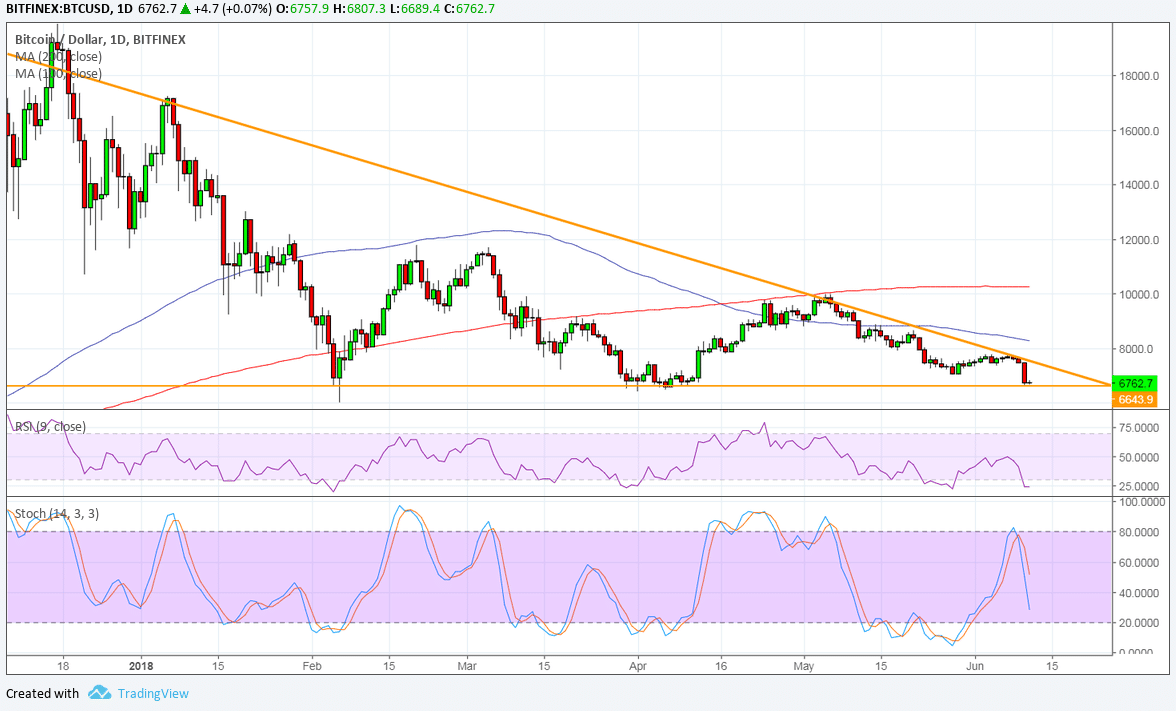
Bitcoin has formed lower highs and found support around $6,600 to create a descending triangle on its daily chart. Price is testing the very bottom of this formation after a recent sharp selloff.
This might be the last line of defense for the bulls as a break below support could open the floodgates for sellers. The chart pattern spans $6,600 to $18,000 so the downtrend could be a really steep one on a break lower.
On the other hand, a bounce could lead to another test of the resistance and perhaps an upside break. This could still lead to a longer-term climb, but the nearby moving averages are likely to keep gains in check.
The 100 SMA is below the longer-term 200 SMA to confirm that the path of least resistance is to the downside. In other words, the selloff is more likely to persist than to reverse. The gap is also widening to reflect strengthening bearish pressure, with the 100 SMA providing a roadblock around $8,000 and the 200 SMA at the $10,000 major psychological mark.
Stochastic has plenty of room to head south so bitcoin could follow suit until the oscillator indicates oversold conditions.

The recent drop is being pinned on a South Korean exchange hack, as Coinrail tweeted over the weekend that the breach affected lesser-known cryptocurrencies such as Pundi X. Bitcoin was not among those mentioned but the spread of anxiety among investors was still evident.
Keep in mind that US regulators continue to investigate price manipulation issues with bitcoin and other altcoins, and the results of their probe could continue to dampen optimism in the industry.
Author Rachel Lee On Jun 11, 2018
David