Bitcoin Skyrockets To $11,000 – How High Can It Go From Here? BTC Price Analysis & Weekly Overview

Bitcoin Skyrockets To $11,000  - How High Can It Go From Here? BTC Price Analysis & Weekly Overview

Bitcoin Skyrockets To $11,000 – How High Can It Go From Here? BTC Price Analysis & Weekly Overview


The most famous cryptocurrency does it again: Just four months ago Bitcoin was trading close to $3000, and now – close to $11,000.

Bitcoin managed to survive drops of more than 80% in its value successfully. Not only survive but overcome and become even stronger than before. Such strength we could have seen during the past three months, following the breakout of the $4,000 zone.

The $11,000 area was the target given to Bitcoin in our analysis from just two days ago. Another thing to note is the action during the weekends. Bitcoin whales plan their action to the weekends, and it’s not a coincidence that the breakout took place when most of the world is off to start another weekend.
 

Total Market Cap: $322.8 Billion (crossed $300 Billion!)

Bitcoin Market Cap: $190.8 Billion

BTC Dominance: 59.1%

Looking at the 1-day & 4-hour charts

– Support/Resistance:

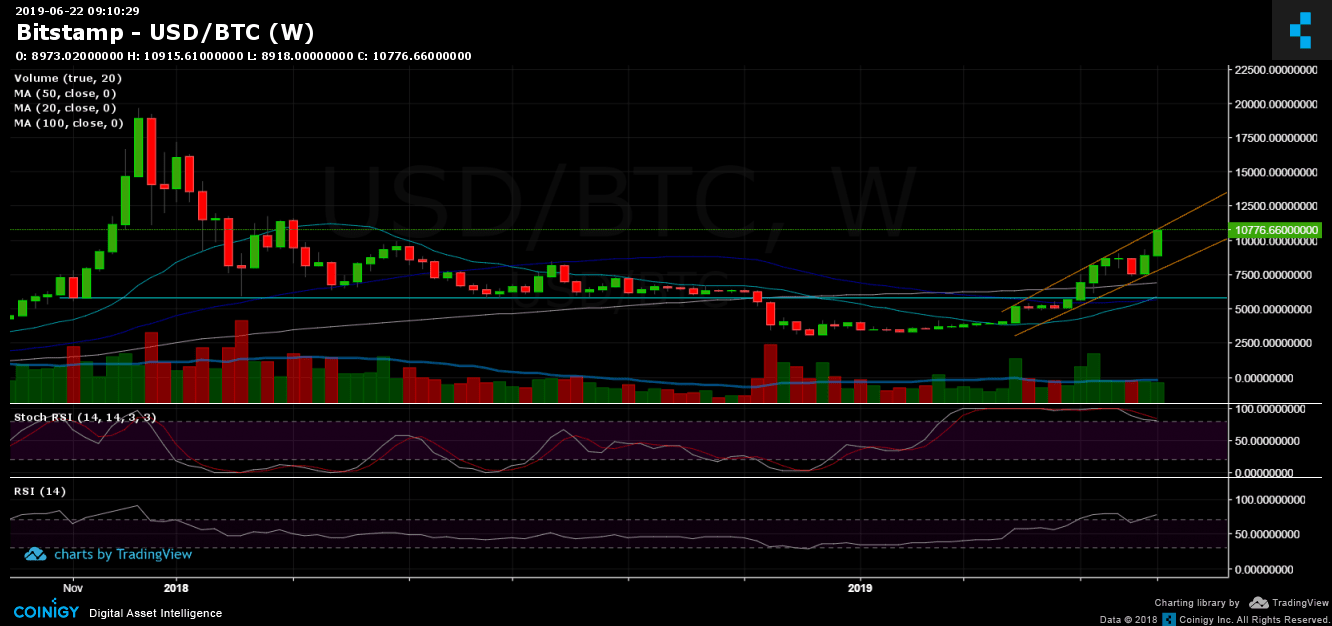
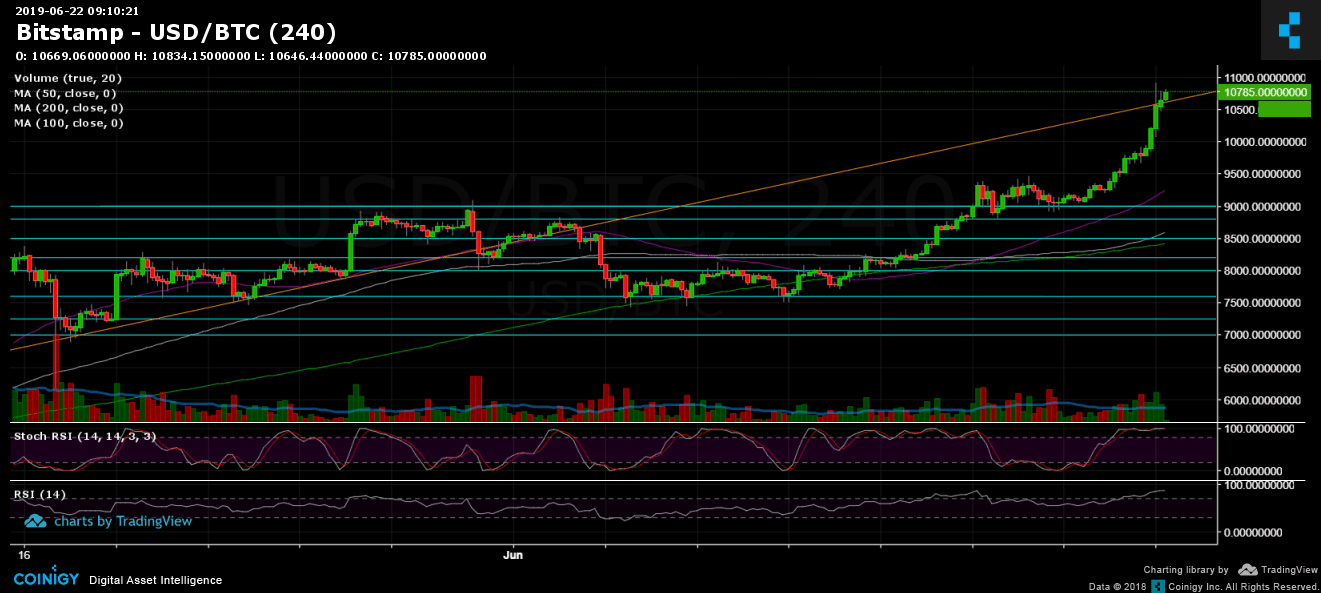
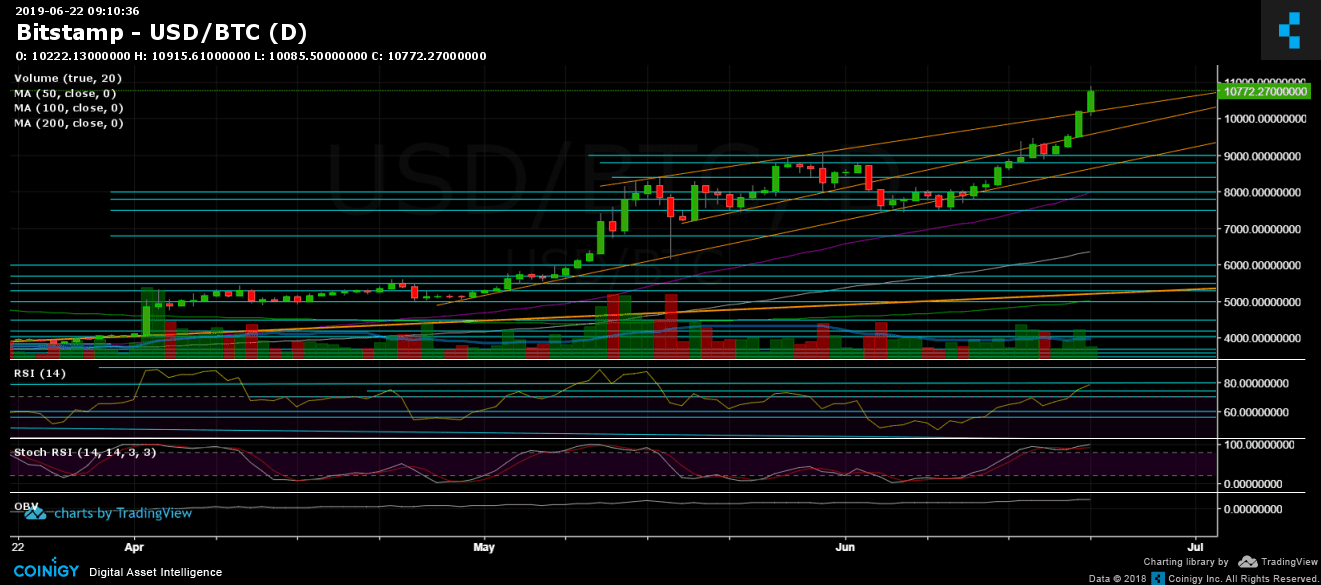
Looking at the daily chart, we can see Bitcoin’s breakout of the upper ascending trend-line (out of the three lines, marked in orange). However, the longer-term weekly chart tells a different story, as the $11,000 serves as a robust resistance level.

Since the coin hadn’t seen a significant correction since the $7500 area, and the fact that Bitcoin is in the middle of yet another parabolic move, at the time when a correction will take place – it will hurt, however, till then you better not disturb the bulls. Anything that goes 3x in three months is unexpected and volatile, to both sides.

Now the closest resistance lies at $11,000. In case that this zone gets broken above, the next significant resistance area is around $11,500 – $11,600, which is the high from February 2018. Further above lies $12,000.

From below, Bitcoin had crossed $10,000 like it was nothing. The nearest levels of support lie at $10,600, $10,200 and $10,000. Below 5 digits is the $9600 – $9700 support area, $9400, $9000 and $8800.

– Daily chart’s RSI: The RSI also broke out above 70 and now facing the 80 level. However, one concern is the divergence in the RSI, both daily and weekly charts. To see the bullish momentum continue, the RSI needs to follow Bitcoin’s price chart in creating higher highs. Another thing to note is that Stochastic RSI of the daily chart is stretched out to the overbought area.

– Trading Volume: The volume is still not record breaking, yet. This is according to the divergence in the RSI. However, this could be due to the fact that it’s partly weekend.

– BitFinex open short positions: Just as expected, the open short positions are gaining momentum along with the rising Bitcoin. There are now 28.8 K BTC of open short positions. This is their highest level since May 11.

BTC/USD BitStamp 4-Hour Chart
BTC/USD BitStamp 1-Day Chart
 

AUTHOR: YUVAL GOV LAST UPDATED ON JUN 22, 2019 @ 09:14 UTC

David
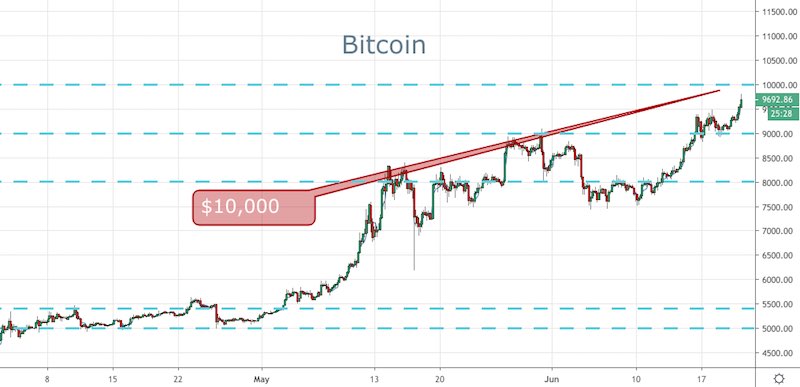
Bitcoin Closes in on $10,000

Bitcoin Closes in on $10,000

Bitcoin Closes in on $10,000

It has been a stellar week for Bitcoin and it looks like the bull run is not over yet.

In Asian trade, BTC has broken out of the overhead resistance area around $9,500-600 region and is pushing higher. Clearly, all eyes are on the $10,000 mark as price continues to ramp up into the huge psychological level.

Interesting, GOLD has also been strong today, with many already calling Bitcoin, ‘digital gold’, there is some irony here. Gold has been strong as I wrote about earlier, thanks to an Iran strike against a US drone. Apparently, Trump considered to take military action but has so far held back.

Bitcoin, on the other hand, is really getting some strong follow-through, thanks to the news that Facebook is launching its own coin. Libra will be used as a payment between users on the entire platform including both Messenger and WhatsApp.

The market has been mixed in its response to the news. Some are saying that it validates the entire concept, while others are urging caution as the move is a stepping stone to companies ultimately controlling the world currencies, which could destabilise the entire monetary system on a global scale.

For the sake of our interests, we are more focused on the price action and given the fact that price has broken resistance, this is not a bad momentum play for a run into the $10,000 level.

As I’ve said before, there is sure to be selling pressure at that point, but at the same time, it will likely act as a magnet. So I would not be surprised to see this run into those highs today or in the next few sessions.

Bottom Line: We are long Bitcoin until proven otherwise. I expect price to test $10,000 and we will keep that long bias until we see how price responds at $10,000.


Posted Friday, June 21, 2019 by Rowan Crosby

David

Bitcoin’s Rally Forgets These Asia Crypto Shares

Bitcoin's Rally Forgets These Asia Crypto Shares

Bitcoin's Rally Forgets These Asia Crypto Shares

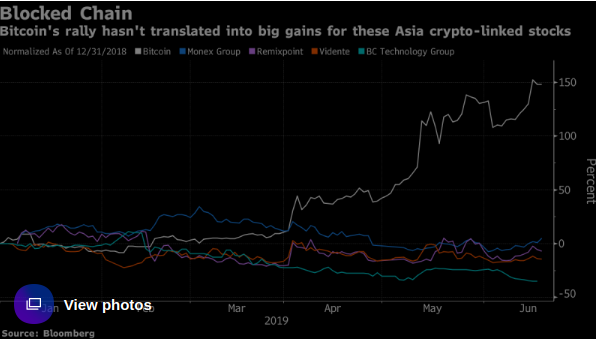
(Bloomberg) — This year’s resurgence of Bitcoin and other cryptocurrencies has yet to translate into the same kind of gains for some of Asia’s more prominent crypto-linked stocks.

The largest digital coin is up about 150% in 2019, surging past the $9,000 level earlier this week ahead of Facebook Inc.’s announcement for a cryptocurrency called Libra, that will be governed by a group of almost 30 companies including Visa Inc., Mastercard Inc. and PayPal Holdings Inc. Facebook shares slipped 0.3% in New York after the announcement Tuesday.

The prospect of Facebook and other mainstream institutions such as JPMorgan Chase & Co. entering the space has been one of the main drivers of the so-called thaw in the “crypto winter” since April. U.S. bitcoin-exposed assets have rallied: Grayscale Bitcoin Trust soared 189% this year, Riot Blockchain Inc. rose 78%, Marathon Patent Group Inc. climbed 50% and Parateum Inc. surged 67%.

But there has been little follow through in Asia.

Monex Group Inc., which owns the Japanese exchange and former hacking victim Coincheck Inc., is down more than 2% this year in Tokyo. The brokerage is counting on its investment in Coincheck to help its securities arm make up lost territory against its competitors.

Others include Remixpoint Inc., operator of crypto exchange BITPoint, which has lost 10% so far in 2019. Vidente Co., a shareholder of South Korean exchange Bithumb, is down 14% this year, while BC Technology Group Ltd., which launched new crypto exchange ANXONE earlier this year is also down 35% amid a wider selloff among Hong Kong-listed stocks.

“Companies that have invested in exchanges, I do think they will lag price appreciation in terms of the stock,” said Vijay Ayyar, Singapore-based head of business development at Luno, a crypto exchange. Companies need to “report at some point and actually show some guidance in terms of how they are able to convert their crypto revenue into fiat dollars.”

While it can be difficult to determine a company’s exposure to crypto relative to its other operations, Ayyar sees three levels by which investors can roughly gauge how closely a stock may move in line with the price of Bitcoin, with the first the most strongly correlated:

Outright ownership of digital assets;Investment in a crypto exchange;Investment in a blockchain project.

“I do think that in crypto, the general consensus seems to be that you are basically better off owning crypto rather than trying to invest in the peripheral stocks,” Ayyar added. “Owning crypto-linked stocks is lesser risk and potentially lesser reward because it’s not going to directly be as lucrative.”

Stock-Market Summary

MSCI Asia Pacific Index ex-Japan up 1.5%MSCI Asia Pacific Index up 1.5%Japan’s Topix index up 1.5%; Nikkei 225 up 1.6%Hong Kong’s Hang Seng Index up 2.2%; Hang Seng China Enterprises up 2.2%; Shanghai Composite up 1.4%; CSI 300 up 1.9%Taiwan’s Taiex index up 1.3%South Korea’s Kospi index up 1%; Kospi 200 up 1.1%Australia’s S&P/ASX 200 up 1%; New Zealand’s S&P/NZX 50 up 1.1%Singapore’s Straits Times Index up 1.3%; Malaysia’s KLCI up 0.3%; Philippine Stock Exchange Index up 0.3%; Jakarta Composite up 0.8%; Vietnam’s VN Index down 0.3%S&P 500 e-mini futures little changed after index closed up 1% in last session


Bloomberg Eric Lam

David

Bitcoin Climbs Above 9,231.6 Level, Up 0.86%

Bitcoin Climbs Above 9,231.6 Level, Up 0.86%

Bitcoin Climbs Above 9,231.6 Level, Up 0.86%

Investing.com – Bitcoin rose above the $9,231.6 threshold on Tuesday. Bitcoin was trading at 9,231.6 by 00:54 (04:54 GMT) on the Investing.com Index, up 0.86% on the day. It was the largest one-day percentage gain since June 17.

The move upwards pushed Bitcoin's market cap up to $164.6B, or 57.12% of the total cryptocurrency market cap. At its highest, Bitcoin's market cap was $241.2B.

Bitcoin had traded in a range of $9,199.2 to $9,336.1 in the previous twenty-four hours.

Over the past seven days, Bitcoin has seen a rise in value, as it gained 16.39%. The volume of Bitcoin traded in the twenty-four hours to time of writing was $15.3B or 29.04% of the total volume of all cryptocurrencies. It has traded in a range of $7,805.7661 to $9,438.1270 in the past 7 days.

At its current price, Bitcoin is still down 53.54% from its all-time high of $19,870.62 set on December 17, 2017.

Elsewhere in cryptocurrency trading

Ethereum was last at $270.01 on the Investing.com Index, up 0.81% on the day.

XRP was trading at $0.44702 on the Investing.com Index, a gain of 3.81%.

Ethereum's market cap was last at $28.9B or 10.04% of the total cryptocurrency market cap, while XRP's market cap totaled $19.2B or 6.65% of the total cryptocurrency market value.

Prices of the major cryptocurrency were mostly higher on Tuesday in Asia, with Bitcoin hovered above the key $9,000 level on Facebook’s reported move into cryptocurrency.

Bitcoin rose 2.1% to $9,267.4 by 11:30 PM ET (03:30 GMT). Ethereum gained 0.7% to $270.23. XRP jumped 4.3% to 0.44642, but Litecoin underperformed and lost 1.5% to $133.058.

Facebook (NASDAQ:FB) is reportedly launching a new digital asset to be used as a peer-to-peer payment within messenger apps. Bitcoin surged immediately following the news, as some analysts said the news could be the biggest boost for virtual coins in history.


Cryptocurrency News10 minutes ago (Jun 18, 2019 12:54AM ET)

David

Bitcoin’s Likely Introduction Of Crypto Pushes Bitcoin Price Above $9000

Bitcoin's Likely Introduction Of Crypto Pushes Bitcoin Price Above $9000

Even though in the Indian context, trading in cryptos is likely to be restricted due to the recent report which may send individuals engaging in cryptos to jail for a 10-year term, in the global world, cryptos are fast gaining ground. Just a week before there was news that a lesser known crypto litcoin has almost surged 4-folds this year on account of halvening, the process that will push up the price of the digital currency as well as prevent erosion in its value.

And no later, Bitcoin, the largest crypto has known to surge to levels beyond $9000 on Facebook optimism as the social media giants is making news rounds of introducing its cryptocurrency. The recent renaissance in cryptos is primarily on the back of the fact that these are seeing a greater adoption from mainstream companies and institutions as well as gained the attention of Wall Street on a more recent basis. The largest digital currency surged 7.4% from late Friday and traded at US$9,006.55 as of 8.49am Tokyo time. Rival coins also climbed: litecoin was up 5.9 per cent and ethereum rose 4.5 per cent.


By Roshni Agarwal| Updated: Monday, June 17,

David

Piixpay Lets You Pay Bills and Invoices With Cryptocurrency

Piixpay Lets You Pay Bills and Invoices With Cryptocurrency

Piixpay Lets You Pay Bills and Invoices With Cryptocurrency

If you need to regularly cover fiat payments but prefer to use your digital assets, a platform like Piixpay can be very helpful. The payment provider allows you to use cryptocurrencies to pay invoices, bills and make other recurring payments to recipients that still accept only traditional money.

Spend Bitcoin Cash, Make Fiat Payments

To initiate a new payment with Piixpay you have to provide the beneficiary’s name and Iban number. You are required to enter the exact amount in euros, as the platform processes bank transfers in Europe’s single currency. You also need to add a short description of the transaction and an optional reference number.

Then you have to choose the crypto you are going to spend. Piixpay currently supports four major digital coins – bitcoin cash (BCH), bitcoin core (BTC), litecoin (LTC), and dash (DASH) – as well as a stablecoin backed by euros. Est-coins (ESCT) are issued by Piixpay’s operator, Ungaro LLC, and have a redemption value of €1 per coin.

Piixpay has another useful feature called Instafill. It lets you link a crypto wallet address to a bank account. Each time coins are sent to that dedicated address, the payment processor will exchange the cryptocurrency and send the fiat to your bank account. You can also check the status of any payment at all times.

To use the services of the crypto payment platform you have to create an account. You can sign up with a valid email address or use your Facebook, Google, Linkedin, Windows or Yahoo account. Piixpay is registered and licensed in Estonia but it operates in over 100 countries around the world.

There’s a service fee of €1 + 1.75% of the amount for transactions funded with cryptocurrencies. Bank transfers cost €1 for transactions within the Single Euro Payments Area (SEPA) and €40 for outside the zone. The smallest amount you can transfer is 1 euro and each transaction is limited to a maximum of €20,000. You can find more information about all applicable fees on Piixpay’s website.

David

BITCOIN – Key Price Levels!

BITCOIN – Key Price Levels!

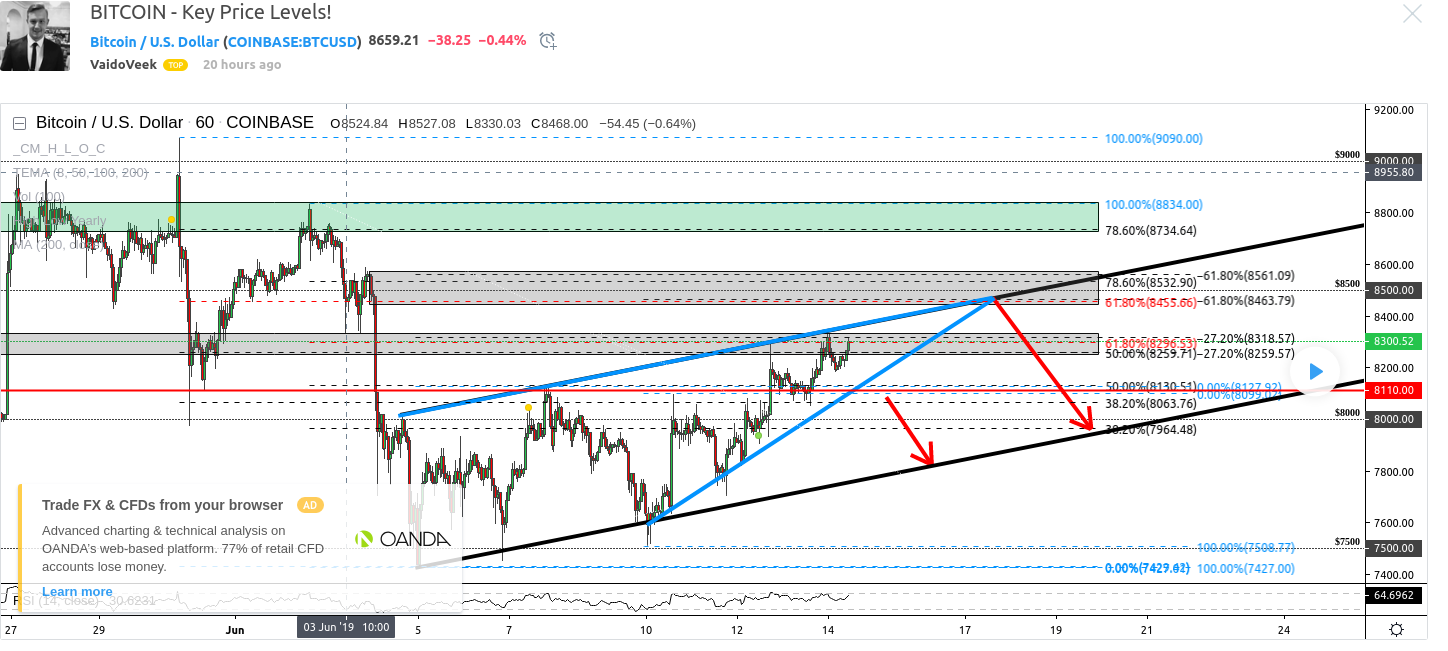
I have struggled with further scenarios, after the bounce from my mentioned level at $7,930, because there are two, almost equal, resistance levels which can play an important role in the next movements.

To be said, I'm still with mid-term bearish bias because of the Weekly bearish candlestick pattern Evening Star . The price can make another $150-$300 leg upwards but still, it doesn't hurt my bias. My bias starts to change after the price has climbed above the $8,700 and the Weekly candle gets a close around that level – the green "box". So, because of my mid-term bearish bias a search selling areas/opportunities.


At the moment, the price moves between $8,200 – $8,300 and this area is also our first resistance area – the lower gray "box".

There are:

– Fibonacci retracement levels 50% & 62% pulled from different tops

– Fibonacci extensions 127%

– The minor trendline (light blue) which is the upper trendline from the bearish chart pattern called Rising Wedge

– The area itself is a significant level. This price level has worked as resistance on mid of the May, beginning of the July it worked as a support and now it should act as a resistance level .

Now, the mentioned struggle – we have some bearish price action on the current levels ( bearish candlestick patterns on the 4H and on the 1H), the level is pretty strong to short BTC from here, from the first gray area but Still, there is something which doesn't allow to do it, I don't know why it doesn't feel right to short it here but probably it is the buyers consistency from $7,500, steady grind upwards is usually pretty bullish for BTC price! So, that's why I'll wait for a further confirmation, if the price still starts to fall lower from the current level then another confirmation comes after the breakout from the bearish chart pattern Rising Wedge – a candle close below the lower light blue trendline and a candle close below the red price level ($8,110)will be a bearish confirmation and you should get at least 1H candle close below that level.


The second selling area stays around $8,500, this area was also the target 2. on my previous post. There are some price action criteria and they should act as resistance levels:

– Fibonacci golden ratio 62% and minor the Fibonacci level 78%

– Fibonacci Extensions 162%

– The round number $8,500 should act as a resistance.

– Depends on the price action but the minor trendline ( Rising Wedge upper trendline ) may act also as a resistance. It depends when it reaches into the higher gray area.

This level is just a little bit more favorable because of the Fibonacci level and visually it looks also better but if it starts to go right away then this area becomes also a bit riskier because then the price is cracked this minor light blue trendline and it can find a momentum to push it through the higher gray box. So, to be more secure then the bearish candlestick pattern is needed on the upper gray area and only valid patterns are bearish Engulfing , Evening Star , bearish Railway Tracks (if you don't know them, google helps you out).

SUMMARY: Pretty simple guidelines – the first area (lower gray zone) gives us a confirmed movement after the breakout from the chart pattern called Rising Wedge and the second area (higher gray zone) can give us a reversal trade opportunity after the bearish candlestick formations! Sell orders, because my bias is bearish because of the Weekly timeframe price action and this can "easily" change and it changes after the BTC price has climbed above the $8,700!


Best regards,

Vaido – Analysts for Swipex

BITCOIN - Key Price Levels!

David

Bitcoin price prediction – Will the bears take BTC/USD below $8,200?

Bitcoin price prediction - Will the bears take BTC/USD below $8,200?

Bitcoin price prediction – Will the bears take BTC/USD below $8,200?

  • BTC/USD is currently priced at $8,205 in the early hours of Friday.

  • The daily confluence detector shows an immensely strong support level at $8,200.

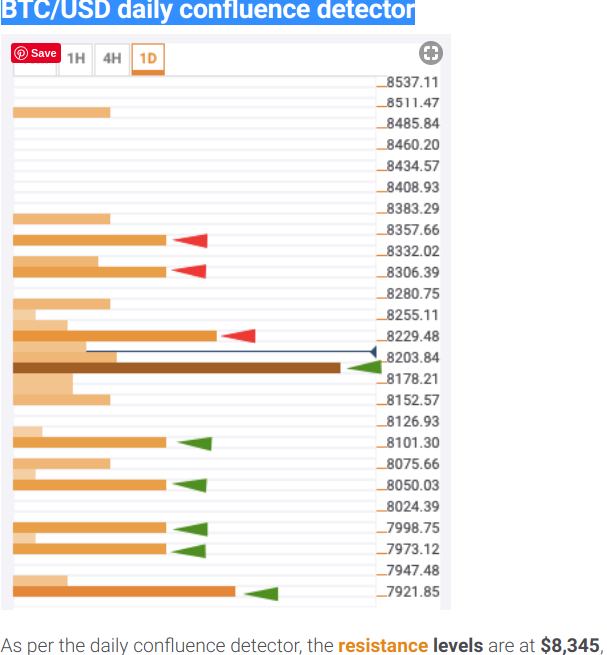
In the early hours of Friday, BTC/USD is sitting above the $8,200 support level and is priced at $8,205. Bitcoin has had a bullish Wednesday and Thursday, wherein the price went up from $7,920 to $8,245. The bulls will need to rally together to keep the price above the $8,200-level. The daily confluence detector shows us that there is a healthy support level at $8,200.

BTC/USD daily confluence detector

$8,325 and $8,250. $8,345 has the meeting of 4-hour previous high and 1-day previous high. $8,325 has the weekly 61.8% Fibonacci retracement level. Finally, $8,250 has the confluence of daily Bollinger band middle curve, daily 38.2% Fibonacci retracement level and 50-day simple moving average (SMA 50) curve.

On the downside, the support levels are at $8,200, $8,115, $8,060, $8,000, $7,980 and $7,925. The confluences at those level. The strongest and the most critical support level is at $8,200, which has the 1-hour previous low, hourly Bollinger band middle curve, SMA 5 and monthly 23.6% Fibonacci retracement level. $8,115 doesn’t have any confluence. $8,060 has the 1-day previous low and 4-hour Bollinger band middle curve. The $8,000 level has the SMA 200 and SMA 5 curves. $7,980 sees the meeting of weekly 38.2% Fibonacci retracement level. Finally, the $7,925-level has the 1-day pivot point support 2, SMA 200 and SMA 10.

Rajarshi Mitra

FXStreet

David

‘ULTRA-BULL CASE’ FOR BITCOIN DRIVEN BY CENTRAL BANKS – ANTHONY POMPLIANO

‘ULTRA-BULL CASE' FOR BITCOIN DRIVEN BY CENTRAL BANKS – ANTHONY POMPLIANO

‘ULTRA-BULL CASE’ FOR BITCOIN DRIVEN BY CENTRAL BANKS – ANTHONY POMPLIANO

The Rundown


  • ‘A Perfect Storm for Bitcoin’

  • Era Defining Moment for BTC

Anthony ‘Pomp’ Pompliano of Morgan Creek Digital believes Bitcoin is about to experience an epoch-defining next 18 months.


A PERFECT STORM FOR BITCOIN’

Speaking to Bloxlive TV earlier in June, Pompliano said the next 18 months will be crucial for Bitcoin. The Morgan Creek Digital co-founder believes the plethora of developments with potentially global economic impacts will contribute to upscaling Bitcoin’s role in the global financial system.

Will Bitcoin Reign as King in Times of Economic Instability? @APompliano shares his thoughts with @BloxliveTV https://bloxlive.tv/stories/s73news/22056-20190604-nob/93906-anthony-pomp-pompliano-talks-bullish-on-btc-us-china-trade-war …

Pomp drew a line linking trade tensions between the U.S. and China, dovish central bank policies and the 2020 Bitcoin halving as important drivers that will have a positive impact on BTC price.

According to Pompliano:

Over the next 12 to 18 months, we are going get a perfect storm for bitcoin. There are a number of events that are going to happen at the same time. Central banks will be forced into some interest rate cuts, maybe some QE. These events [will] ultimately drive Bitcoin into an ultra-bull case.

Already, several market analysts warn that the current global economic trajectory is one tending towards another financial crisis. Bitcoin appears to be in prime position to ride this tumultuous economic wave, offering, as Bitcoinist called it in an op-ed late last year, “a non-political alternative to the money printing pyramid.”

ERA DEFINING MOMENT FOR BTC

Monetary policymakers around the world from the Federal Reserve in the U.S. to the Bank of Japan (BOJ), and the European Central Bank (ECB) are all adopting dovish policies.

There are reports of adopting rate cuts or even zero-interest-rate policy (ZIRP), not to mention the seemingly permanent quantitative easing used to paper over the cracks of a deteriorating market.

Bitcoin emerged after the 2008 financial crisis and the next year-and-a-half could potentially form its defining crucible. This ‘digital gold’ is already providing a suitable shelter for investors against the coming financial storm. Ironically, it is the banks themselves that could further solidify its status as the prime driver in the separation of money and state.

federal reserve system

If the separation of church and state opened the way for religious and political freedom, Bitcoin proponents argue that a politically-neutral, opt-in monetary system could do the same for economic freedom. In other words, it can do to money what the internet did for information.

Bitcoin in many ways has the ability to ‘scale trust’ in society by completely removing it from the equation. This will be particularly important when it comes to transferring and storing value compared to the ‘full faith and credit’ fiat money that has been holding the global financial system hostage.

Bitcoin will hopefully be a fully realized store of value when, not if, the credit bubble inevitably bursts


OSATO AVAN-NOMAYO · @3RDPESINSINGULA | JUN 12, 2019 | 15:00

David

Bitcoin (BTC) Price Approaching Next Break – Bullish or Bearish?

Bitcoin (BTC) Price Approaching Next Break -  Bullish or Bearish?

Bitcoin (BTC) Price Approaching Next Break – Bullish or Bearish?

  • Bitcoin price recovered recently above $7,900 and $8,000 against the US Dollar.

  • The price failed to stay above $8,000, formed a swing high at $8,080, and recently declined below $7,900.

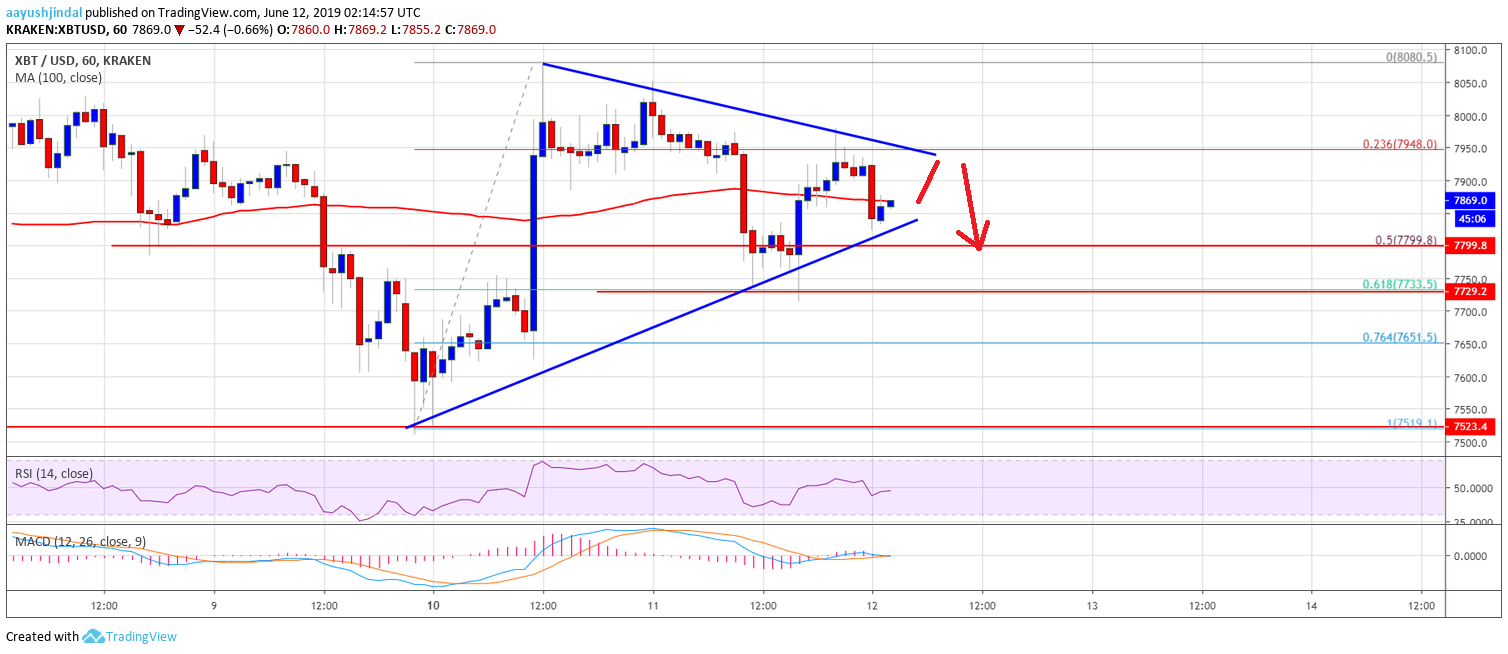
  • There is a key breakout pattern forming with resistance near $7,940 on the hourly chart of the BTC/USD pair (data feed from Kraken).

  • The pair is currently under pressure and there is a risk of more losses below the $7,800 support.

    Bitcoin price failed to gain momentum above $8,000 and declined recently against the US Dollar. BTC is currently approaching the next break and it might breakdown if the bulls struggle near $7,950.

Bitcoin Price Analysis

Recently, bitcoin price started a decent recovery above $7,800 and $7,900 against the US Dollar. The BTC/USD pair even broke the $8,000 barrier and the 100 hourly simple moving average. However, the price failed to gain bullish momentum and formed a swing high at $8,080. As a result, there was a fresh decline below the $8,000 support area. The price broke the 23.6% Fib retracement level of the recent recovery from the $7,520 swing low to $8,080 high.

There was also a spike below $7,900 and the 50% Fib retracement level of the recent recovery from the $7,520 swing low to $8,080 high. Finally, the price broke the $7,800 support area before the bulls took a stand near the $7,750 level. Moreover, the 61.8% Fib retracement level of the recent recovery from the $7,520 swing low to $8,080 high acted as a strong support. At the moment, the price is trading above $7,800 and the 100 hourly SMA. More importantly, there is a key breakout pattern forming with resistance near $7,940 on the hourly chart of the BTC/USD pair.

Therefore, the pair seems to be preparing for the next break either above $7,950 and $8,000 or below $7,800. If there is an upside break above $8,000, the price is likely to climb further higher. A follow through above $8,080 is likely to put the bulls in control. The next important resistance is near the $8,200 level. On the downside, an initial support is near the $7,800, below which the price could decline again towards $7,600.

Looking at the chart, bitcoin price is showing a few bearish signs below $8,000 and $7,900. If there is a fresh decline below $7,800, the price could move back in a bearish zone. It may also diminish the chances of a break above $8,200.

Technical indicators:

Hourly MACD – The MACD is losing momentum in the bullish zone.

Hourly RSI (Relative Strength Index) – The RSI for BTC/USD is currently below the 50 level and is moving higher.

Major Support Levels – $7,800 followed by $7,700.

Major Resistance Levels – $7,950, $8,000 and $8,080.


Aayush Jindal

1 min ago


David