Bitcoin weekly price analysis – 6.11.2018
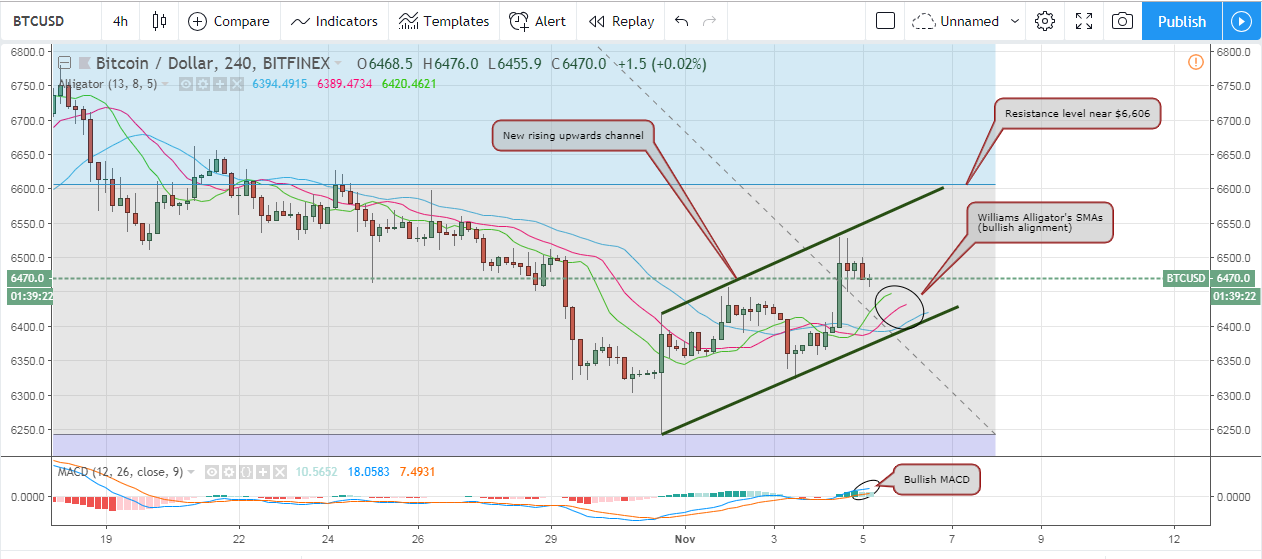
After dropping down to a low of $6,242 last week, bitcoin price started rising regularly hitting a week high of $6,529. Even though technical analysis of last week’s charts denoted that we are likely to witness a bearish market during most of the week’s trading sessions, a new upwards wave began manifesting itself last Wednesday following a short bearish move. The BTCUSD pair seems to be moving within a new rising upwards channel, which will not face significant resistance except around the $6,606 price level.
Bitcoin price and the news:
Last week witnessed circulation of news around a letter reporting supposed solvency of Tether (USDT), as a result to Tether’s new bank headquartered in the Bahamas (Deltec). Tether’s problems and allegations concerning Bitfinex’s insolvency have been raising significant concerns among the crypto community during the past few weeks.
Bitcoin traders are still waiting for serious decisions to come out from the SEC during the next few weeks. The SEC is expected to soon decide whether or not to approve Bitcoin ETFs. Also, the SEC is on its way to regulate ICOs with emphasis on three key elements of this blockchain based crowd funding process – issuers of ICOs, investors of unregistered ICOs, and exchanges facilitating trading of unregistered ICOs.
The retail banking giant JP Morgan is about to release its very own blockchain, which is expected to offer its huge client base a myriad of trading opportunities.
HTC, the Taiwanese mobile phone manufacturer, is launching its first blockchain-friendly smartphone, which is expected to feature compartmentalized storage of various forms of blockchain based data. The highly anticipated mobile phone will be available for purchase via cryptocurrencies only.
New rising upwards channel on the 4 hour BTCUSD chart:
Let’s examine the 4 hour BTCUSD chart from Bitfinex, while plotting the Williams Alligator’s SMAs, and the MACD indicator as shown on the below chart. We can note the following:

– Last week started with the market’s bears having the upper hand, managing to pull price downwards from around $6,512 all the way down to a week low of $6,242 on Wednesday. Thereafter, the market’s bulls gained control pushing the price steadily upwards to a week high of $6,529 on Sunday.
– Since last Wednesday, bitcoin price began recording higher lows during most of the trading sessions. Also, higher highs can be spotted on around 50% of the candlesticks on the 4 hour chart. The rising trend line formed by the highs, as well as the rising trend line formed by the lows formed a “rising upwards channel” (the two parallel green trend lines on the above chart). Bitcoin price has been moving throughout this new rising channel since last Wednesday, and is likely to continue rising throughout this channel until facing resistance around the $6,606 price level, which represents the 76.4% Fibonacci retracement between the high at $7,788 and the low at $6,242.
– The SMAs of the Williams Alligator have re-aligned themselves to exhibit a bullish alignment as bitcoin price began rising throughout the new rising channel. On Sunday, the green SMA (lips) moved on top of the red SMA (teeth), which rose above the blue SMA (jaw). As such, it is said that the alligator’s mouth has opened and will start eating, so we can expect to see a stronger bullish wave during the upcoming few days.
– The aforementioned bullish signals are confirmed by the MACD which is also exhibiting a bullish signal. The blue MACD line is on top of the red signal line and both are sloping in an upwards direction in the positive territory.
Ichimoku Cloud still red on the 1 day BTCUSD chart:
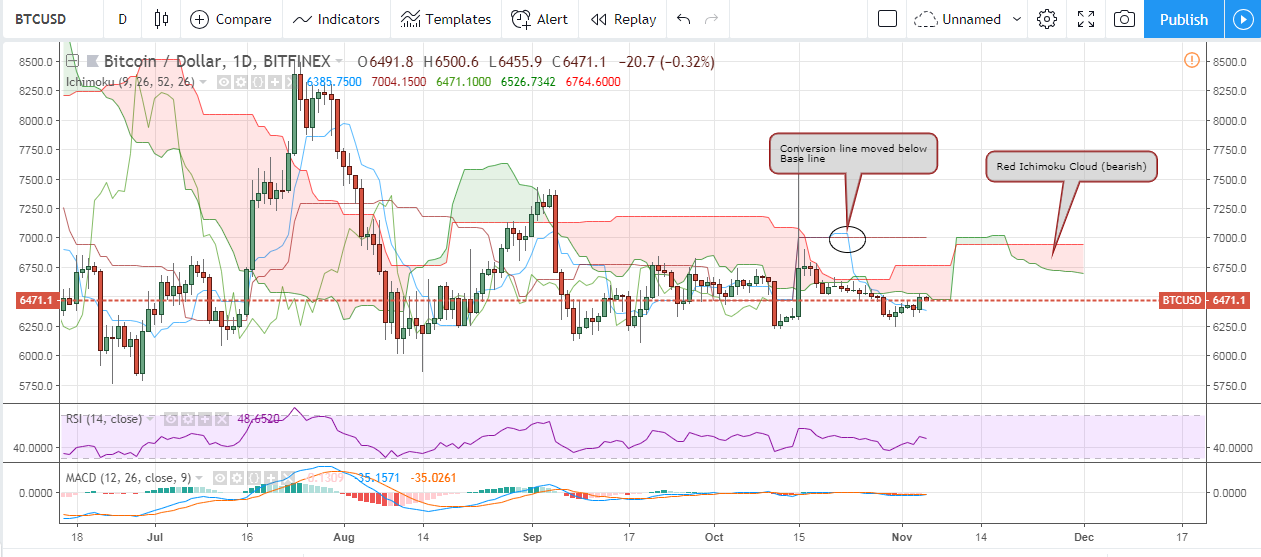
Now, let’s examine the 1 day BTCUSD chart from Bitfinex while plotting the Ichimoku Cloud, the RSI, and MACD indicator as shown on the below chart. We can note the following:

– The bullish signals we spotted on the 4 hour chart are not confirmed by analyzing the 1 day chart, as the Ichimoku Cloud is reddish (bearish), and its Conversion line (blue) has moved below the Base line (red). Also, candlesticks are below the cloud.
– The RSI level is near 50, which is more or less indecisive. The MACD indicator is in the negative territory and the MACD line is below the signal line.
Conclusion:
After recording a low of $6,242, a new bullish wave started building up last week pushing bitcoin price to a week high of $6,529. As bitcoin price is now moving throughout a new rising upwards channel, we can expect it to continue rising during the upcoming week towards the resistance around $6,606, even though we cannot confirm the bullish move by analyzing the 1 day BTCUSD chart.
POSTED BY: TAMER SAMEEH NOVEMBER 6, 2018

David