Gold's weakness remains as the dollar dominates with more upside potential
Although gold is trading fractionally higher today, by no means can we say that a rally has begun or that this is the beginning of a potential pivot and key reversal from bearish to bullish. The fate of gold pricing remains intrinsically tied to dollar strength or weakness. In the current economic scenario, it is dollar strength that is overwhelmingly moving gold to lower pricing. The dollar has been moving in a near parabolic manner and today is fractionally higher following exceedingly strong upside moves of 1% each day for the last two trading days.

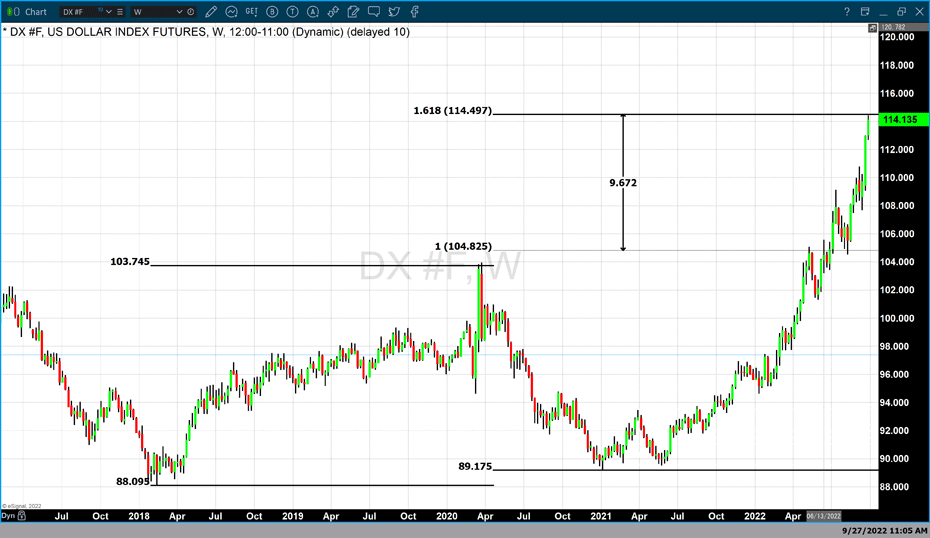
As of 4:50 PM EDT, the dollar index is up 12 points or 0.11% and is currently fixed at 114.14. The chart above is a weekly chart of the dollar index in which we have added a Fibonacci extension. This extension was created over two weeks ago and currently, the dollar index is just below the forecast created from the extension.
According to Investopedia, "Fibonacci extensions are a tool that traders can use to establish profit targets or estimate how far a price may travel after a pullback is finished. Extension levels are also possible areas where the price may reverse.
They're created from three price points marking price levels of key tops and bottoms. In essence, a Fibonacci extension will forecast how far the next price wave or rally could move before finding resistance. In the case of the chart above, we used a weekly chart beginning at 88.095 the low achieved during the beginning of 2018 as the first price point. The second price point occurred in April 2020 when the rally that began in 2018 concluded with the dollar index at 104.825. The third price point is based upon the correction from the termination of the rally in April 2020 at 104.825 to the conclusion of the correction in January 2021 when the dollar corrected to 89.175.

From these three price points, we then do a price extension and in the case of a strong rally, we will look for the rally to move as high as 1.618% of the price differential between the first two price points. In the case of the Fibonacci extension study above a 1.618 extension occurs at 114.497. Today the dollar continues to move fractionally higher trading to a high of 114.425 and is currently fixed at 114.13. In other words, the Fibonacci extension was able to forecast the first level at which the dollar might encounter some resistance.
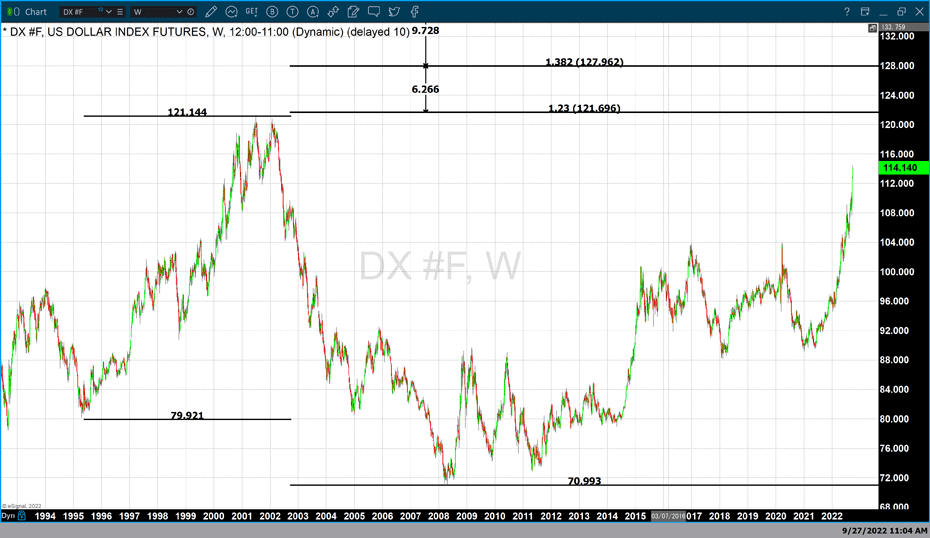
Fibonacci extensions can be created from different time cycles or using different tops and bottoms. The second chart is also a Fibonacci extension from a weekly chart. However, we are using a much longer time sequence beginning at a low that occurred during the first quarter of 1995 when the dollar index concluded a correction at 79.921. The rally that followed lasted until 2002 when the dollar index reached 121.144. The third price point is the conclusion of the correction that began at 121.144 and occurred at 70.993. In this study, we are looking at the potential for the Fibonacci extension to go to either 1.23% which occurs at 121.696, or 1.382% which occurs at 127.962.
In other words, based on these technical studies the dollar index may find fractional resistance at its current pricing of 114.49. However, any correction will probably be shallow and short-lived and the dollar will return to its upward trajectory reaching 121.70 at minimum.
As long as the Dollar remains strong and moves to higher ground, which is likely as the Federal Reserve continues to raise rates which will increase the yields on U.S. debt instruments that will lead to more dollar strength, gold will continue to remain under pressure.
By Gary Wagner
Contributing to kitco.com
Time to buy Gold and Silver on the dips
David