Gold/Silver: The critical indicator every silver trader is watching
Happy Easter to all of you, and with Good Friday here, the markets enjoy an early close after the release of the monthly Nonfarm payroll report. The number narrowly beat expectations showing an increase of 236,000 jobs, and the initial reaction gave a favorable boost to the U.S. Dollar and Treasury Yields. Unfortunately, the Precious Metals markets are closed today, leaving Sunday night as a possible "volatility event" as the markets try to price what a stronger report will mean for the Fed at their next meeting. Looking back from the lows in March, Gold has rallied $200 and Silver over $5, leaving both markets susceptible to a correction. For those currently long, we will continue to lift protective stop losses and use options to add to positions while concentrating on "undervalued" metals such as Copper and Platinum.
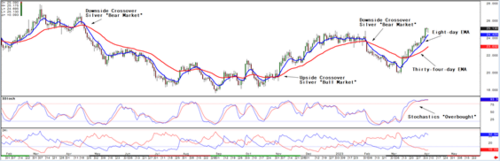
Daily May Silver Chart
.png)
The technical backdrop shows Silver extending the "Bull flag pattern" we identified several weeks back while continuing to achieve new swing highs and breaking through the consolidation zone seen from December through February. We remain cautiously optimistic as most technical indicators show the market substantially "overbought," as seen through the slow stochastic indicator. The eight-day exponential moving average (EMA) has worked exceptionally well in helping Silver traders from a risk management standpoint and looking to exit their positions on the first close below. Traders will then wait to see if an extended selloff occurs by analyzing if a crossover occurs with the eight-day EMA crossing below the thirty-four-day EMA. If that event happens, we could be setting up for a multi-week correction.
To further help you develop a trading plan, I went back through 20 years of my trading strategies to create a Free New "5-Step Technical Analysis Guide to Gold that can easily apply to Silver." The guide will provide you with all the Technical analysis steps to create an actionable plan used as a foundation for entering and exiting the market. You can request yours here: 5-Step Technical Analysis Guide to Silver.
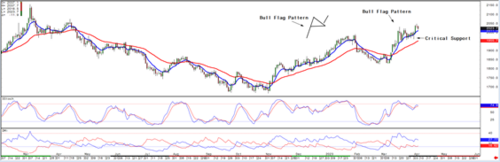
Daily June Gold Chart
The technical backdrop in Gold shows a different picture from Silver as the market successfully "broke out" from the "Bull Flag" pattern we identified in last week's article. However, without a continuation above $2050, traders should use any close below $2000 as the first warning sign that a correction could be brewing. A critical level we are watching is the March 21st downward spike low to 1965.9, now the first significant support. A break below 1965.9 will begin signaling a near-term failure. Therefore, we would be only cautiously Bullish and reevaluating upon such a move. For those working closely with us, most of you are working stops below the $1955 level on a "Good till Cancelled" basis.
Having the flexibility to enter and exit the market quickly makes it essential for Precious Metals investors to have a futures trading account alongside their core Physical Precious Metals holdings. If you are interested in speculating on the rise and fall of the price of Precious Metals on a shorter-term basis, such as two weeks or two months, or If you have never traded futures or commodities, I just completed a new educational guide that answers all your questions on transferring your current investing skills into trading "real assets," such as the 1000 oz Silver futures contract. You can request yours here: Trade Metals, Transition your Experience Book.
By
Phillip Streible
Contributing to kitco.com
David