Investors speculate on Fed’s decision next week as inflation remains persistent

Investors speculate on Fed’s decision next week as inflation remains persistent

A primary purpose of holding or investing in gold is to protect one’s portfolio against high inflation. It has always been considered an inflationary hedge. Simply put, one can extrapolate that if interest rates remain elevated or spike higher it will provide bullish tailwinds supportive of higher gold pricing.

This is true with one exception; when the Federal Reserve is initiating either quantitative tightening or quantitative easing. Currently, the Federal Reserve is completing a multiyear period of quantitative tightening in which they have raised interest rates from historic lows of 0% to a ¼%, all the way to between 5 ¼% and 5 ½%.

Higher interest rates exude a bearish influence on gold because gold does not contain any intrinsic yield. When fixed income assets such as treasuries have high yields it diminishes the allure for gold. This scenario is the economic environment that we find ourselves in today.

One-Two Punch

This week two important reports revealed new data concerning current inflationary pressures. The Consumer Price Index revealed that inflation for February came in hotter than expected. Yesterday’s release of the most current Producer Price Index revealed that producers raised the price of their goods by 0.6% during the month of February. Because a hot PPI is a precursor to a hot CPI we can expect that inflation this month could continue to be elevated.

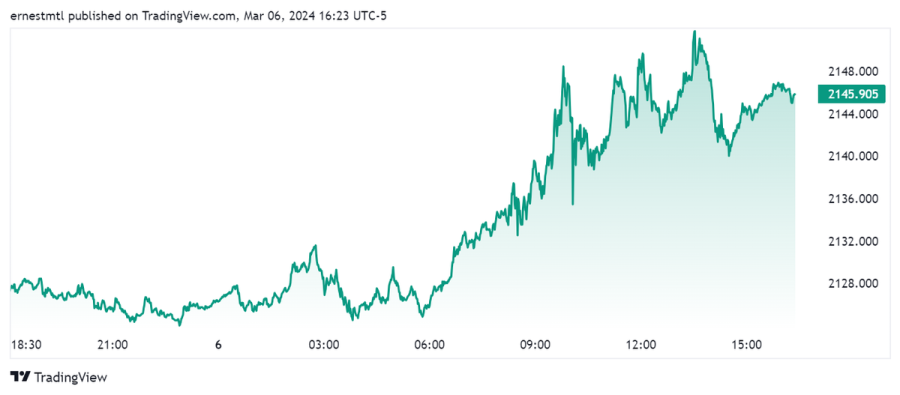
This has pressured gold off the highs achieved last Friday. Tuesday's release of the CPI took gold futures down $25, and on Wednesday gold recovered gaining back approximately $15 of Tuesday’s decline. For the remainder of the week, gold softened but still did not trade to a lower low than the low achieved on Tuesday.

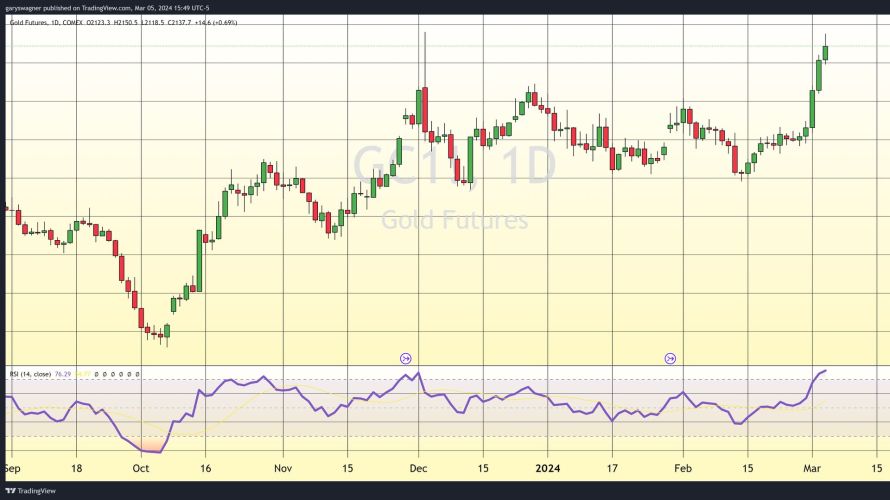
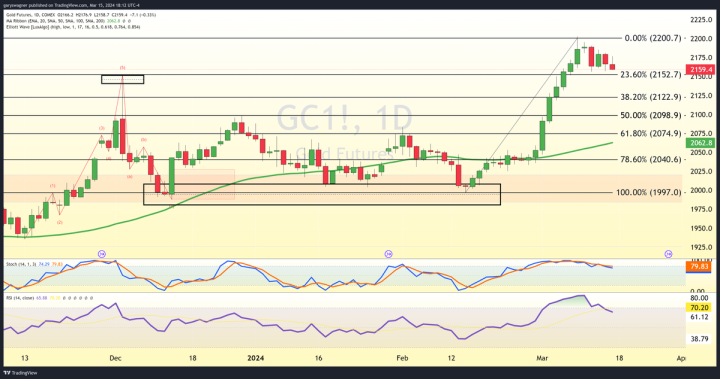
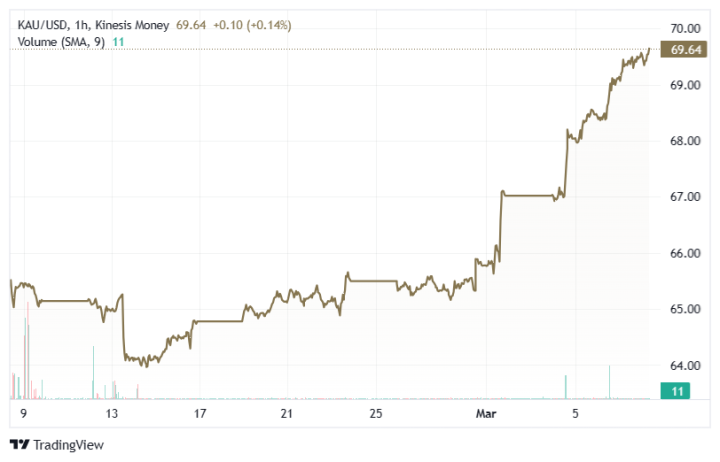
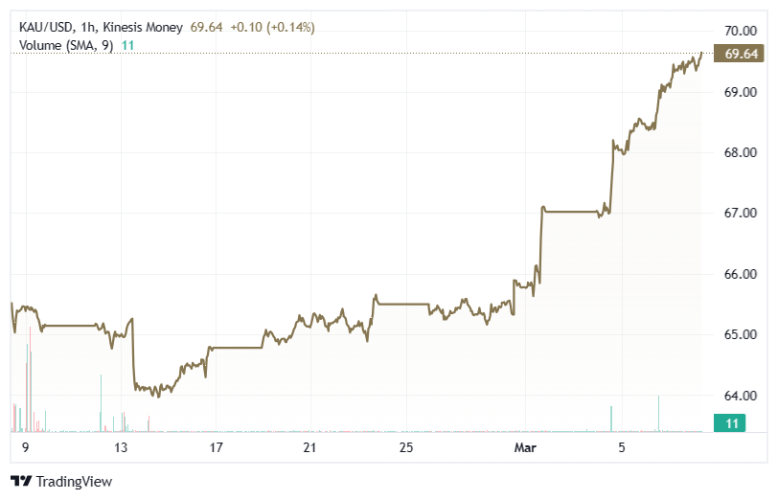
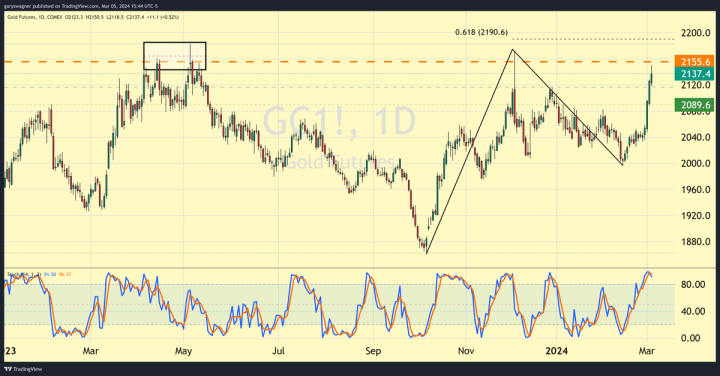
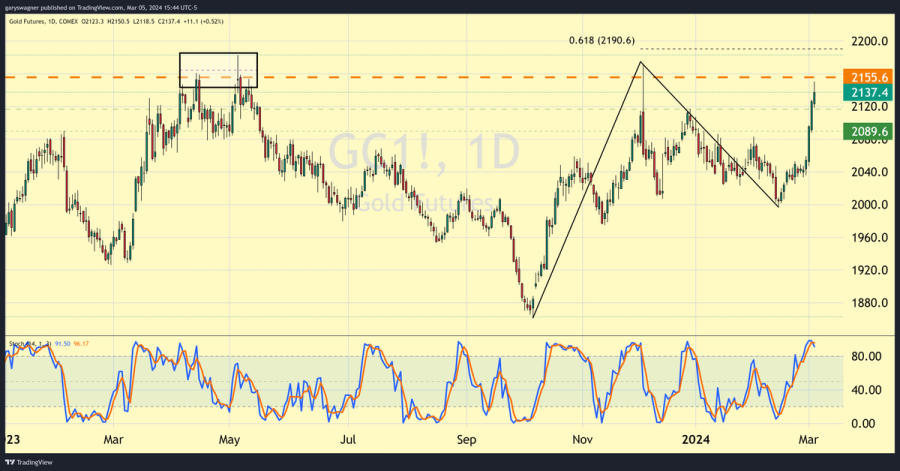
One week ago, gold futures challenged $2200 per ounce and traded to a high of $2203. The price of gold above $2200 for the first time in history was short-lived, but the fact that gold has remained above $2150 all week is a sign that a base is being formed, and we may see that price tested again soon. Gold has been extremely resilient and able to hold onto most of its recent gains even with moderate headwinds from dollar strength, and higher treasury yields.

As of 6 PM EDT, gold futures basis the most active April contract is currently fixed at $2159.40 after factoring in today’s modest decline of $7.10 or 0.33%.

Market participants will now begin to enter a “wait-and-see mode” as the Federal Reserve will begin the March FOMC meeting. According to the CME’s FedWatch tool, it is almost a certainty that they will not announce or initiate any rate cuts for March. They will however release their most current economic outlook and release a revised “dot plot” an integral component of the SEP (summary of economic projections). The dot plot released in February anticipated that the first set of rate cuts by the Federal Reserve would begin this year and anticipated that they would cut rates by three-quarters of a percent. They also projected continued rate cuts in 2025, and 2026 as they “normalize” its benchmark interest rates (fed funds rate) just above 3%.

If there are no major changes in the dot plot released next week in essence that information should already be factored into current pricing and be supportive of gold prices maintaining value.
 

Gary S. Wagner

Time to Buy Gold and Silver

David

Gold Price News: Gold Pulls Back From All-Time Highs

Gold Price News: Gold Pulls Back From All-Time Highs
 

Frank Watson

Gold News

Market Analysi

Gold prices pulled back slightly on Tuesday from their recent all-time highs after figures showed US inflation at higher-than-expected levels in February, prompting questions over any interest rate cuts.

Prices eased as low as $2,153 an ounce during the day Tuesday, compared with around $2,182 an ounce in late deals on Monday.


KAU price $/g – from Kinesis Exchange

US core inflation figures, which strip out volatile items such as energy and food, were released Tuesday. The figures came in at 0.4% in February compared with January, higher than the market’s expected 0.3%. And on a year-on-year basis, February came in at 3.8%, slightly above market expectations of 3.7%.

Higher than expected inflation suggests greater pressure on the US Fed to maintain higher interest rates for longer, weighing on non-yield-bearing assets like gold.

The US dollar also increased against other major currencies on Tuesday, weighing on dollar-denominated gold prices, while US 10-year Treasury yields also rebounded, adding further to the selling pressure on gold.

The pullback in prices follows all-time highs for gold, which briefly hit $2,195 an ounce on Friday as the markets bet on rate cuts materialising as soon as June, with additional support coming from recent central bank buying and safe-haven flows amid current heightened geopolitical tensions.

Elsewhere, the markets will be looking ahead to Thursday for the release of US producer prices for February as well as monthly retail sales, providing a further update on the state of the US economy.

Time to Buy Gold and Silver

David

Gold Price News: Gold Closes in on $2,200 an Ounce Level

Gold Price News: Gold Closes in on $2,200 an Ounce Level

Gold prices extended their recent gains on Friday to cap a particularly bullish week in which prices notched up fresh all-time highs.

Prices rallied as high as $2,195 an ounce on Friday, although prices eased back to trade at around $2,180 an ounce later in the day. That compares with around $2,160 an ounce in late deals on Thursday.

Gold hits all-time high – KAU price $/g – from Kinesis Exchange

US unemployment figures released Friday came in at 3.9%, well above market expectations of 3.7%, and this contributed towards expectations that the US Fed will need to cut interest rates in the coming months – a supportive element for precious metals prices.

This followed US Fed Chair Jerome Powell’s comments on Wednesday and Thursday highlighting that US interest rates have likely peaked and that cuts are on the horizon, albeit that the central bank will need to see greater evidence that inflation levels are moving toward the targeted 2% before adjusting rates.

US non-farm payrolls figures released Friday showed a larger than expected increase in jobs in February. This would normally be expected to put downward pressure on gold prices as a safe-haven asset. However, the gold market shrugged off the latest figures, as bullish momentum continued as the markets bet on a more dovish monetary policy emerging from the US Fed before the summer.

In addition, the US dollar continued to slide against other major currencies through the week, providing a lift for dollar-denominated gold.

Looking ahead, Monday is looking light on significant data releases and the markets will be looking ahead to Tuesday’s US monthly inflation figures for further insight into the future path for monetary policy.

Time to Buy Gold and Silver

David

Gold Price Forecast – March 2024

Gold Price Forecast – March 2024

Key Takeaways

The gold price is still trading above $2,000 an ounce despite a challenging scenario.

The demand for gold from jewellery, the industrial sector and central banks remains strong.

The price of gold could find a new positive impulse above $2,070, while a decline below $1,980 would denote weakness.

Gold Forecast for March

Despite a challenging environment, gold is still trading above the $2,000 an ounce mark. What are the main market drivers for gold to monitor in March, and what could we expect from the price of gold in the next few weeks?

Let us explore the scenario, starting with a brief macroeconomic analysis.

Gold and macroeconomic scenarios

In February, the US Dollar remained strong, while bond yields extended the rebound that started in the first weeks of the year. The latest inflation data released in the United States was hotter than expected (3.1% vs forecasts of 2.9%), indicating a prolonged journey towards the Federal Reserve’s 2% target. This situation has reduced the pressure on the Fed to cut rates from the current record level of 5.50%. Investors are now fairly convinced that any reduction in borrowing costs won’t commence until at least the May meeting, possibly even June.

This persistent hawkish stance has not dampened enthusiasm for equities, while Bitcoin has returned above $50,000.

In this context, gold found itself in a less favourable position, with alternative assets temporarily diverting investor interest away from precious metals. Despite this, gold exhibited little volatility. The only significant decline was triggered by the release of the US inflation at higher-than-expected levels – but gold demonstrated resilience, quickly recovering to surpass the $2,000 mark.

Gold Market Drivers

The timing of the next moves from central banks remains the key market driver for gold. Any news of sooner-than-expected rate cuts could lift up bullion prices, while further hawkish rhetoric could be a bearish catalyst for gold. Also, the geopolitical situation needs to be monitored carefully, with the demand of gold as a safe haven investment that could increase in case of escalation of tensions in the Middle East. As we will analyze later, the physical demand of gold remains strong, supporting the market.

Gold Technical Analysis

In the first six weeks of 2024, bullion oscillated in a tiny lateral trading range between $2,000 and $2,060. The dip following the US inflation data was quickly absorbed, confirming the solidity of the market.

From a technical perspective, a clear surpass of the resistance levels of $2,070-2,080 could pave the way for further gains, with the next target on the record high around $2,130. Should bearish impulses take hold, the first support levels are placed at $1,980, aligning with February’s low, and $1,930, at the bottom reached in November 2023. For now, the low of last October at $1,810 seems a distant threshold.

Gold demand

In a recent report, the World Gold Council highlighted that “2023 was marked by surprising resilience in jewellery and technology demand”, adding that it “considers it likely that last year’s levels will be repeated in 2024”.

Moreover, “central bank buying maintained a breakneck pace, with annual net purchases of 1,037 tonnes, almost match[ing] the 2022 record”. The robust demand from the jewellery and technology sectors and central bank acquisitions have compensated for the outflows experienced in the ETF sector. This trend will likely continue in March and the next few months, with central banks remaining active buyers while the demand from passive funds remains weak.

Carlo is an external market analyst for Kinesis Money. With a credential background in Economic Finance and International Exchange (MA), Carlo’s critical analysis of gold and silver markets’ performance is frequently quoted by leading publications such as Forbes, Reuters, CNBC, and Nasdaq.

Time to Buy Gold and Silver

David

Gold Price News: Gold Extends All-Time Highs

Gold Price News: Gold Extends All-Time Highs

Gold prices extended their recent gains on Thursday to hit fresh all-time highs of over $2,160 an ounce.

Prices notched up a high of $2,164 an ounce on Thursday, compared with around $2,148 an ounce in late deals Wednesday.

Several bullish factors have combined to propel gold prices to record highs in recent days. In particular, weaker economic data from the US has prompted traders to up their bets on an interest rate cut in June. Data from interest rate traders now indicate a probability of just over 70% for the US Fed to start cutting rates at its June 12th meeting, of which most expect a 25 basis-point cut and a minority gunning for a 50 basis-point cut.

Any lowering of interest rates reduces the appeal of holding cash or government bonds, and boosts interest in non-yielding assets like precious metals.

Fed Chair Jerome Powell was quoted on Wednesday saying the central bank needs more evidence that inflation is easing before going ahead with interest rate cuts, although he also signalled that rates have likely reached their peak at the current 5.25-5.5%, in comments to a congressional hearing.

The market’s expectations on monetary policy have also coincided with a period of strong central bank buying of gold in recent months, which has been further augmented by a risk premium due to geopolitical instability and the risks this poses to commerce and financial markets.

Looking ahead, the markets will be watching out for monthly US non-farm payrolls figures on Friday as well as the unemployment rate for February for a further health check on the state of the US economy.

Frank’s experience covering the commodities markets spans 22 years, with a particular specialism in metals, carbon and energy markets. He has worked as a senior editor for S&P Global Commodity Insights (formerly Platts) and before this, at ICIS-LOR, a part of Reed Business Information (Reed Elsevier), where he covered the petrochemicals markets from 2003 to 2005.

Time to Buy Gold and Silver

David

Gold price vs. Bitcoin price record rally: Mixed market signals, here’s what it all means — Gareth Soloway

Gold price vs. Bitcoin price record rally: Mixed market signals, here's what it all means — Gareth Soloway

(Kitco News) – Are the gold and Bitcoin rallies sending mixed messages to the market, and which narrative should investors pay attention to more? Gareth Soloway, Chief Market Strategist at VerifiedInvesting.com, breaks down the two signals.

Even though gold and Bitcoin rallied in tandem — the two assets sent different kinds of messages to the market about the global risk appetite, Soloway told Michelle Makori, Lead Anchor and Editor-in-Chief at Kitco News.

As Bitcoin topped $69,300 and set a new record high on Coinbase — the largest crypto exchange in the U.S. — on Tuesday, gold rallied to new all-time highs above $2,100 and even extended that rally the following day, trading above $2,150 an ounce.

A simultaneous record high for gold, a traditional safe-haven, is in contrast to Bitcoin, which still trades as a risk asset despite being viewed by some as a store of value, Soloway said.

"The risk-on environment is driving Bitcoin. We've seen the stock market making new all-time highs. The NASDAQ has been really running, but we've seen other sectors in the S&P lagging technology," he explained. "That's been driving the stock market in Bitcoin with money flow. There's also excitement about the spot ETF inflows. The talk has been contributing to this GameStop, AMC-type run in this asset."

In gold's case, Soloway points to smart money getting involved in the trade. "I'm convinced that smart money is at a point here where they're starting to say, this is a bubble in these risk assets, and therefore, they're rotating [into gold.] You got the momentum kicking in now," he said.

Soloway pointed out that viewing gold as unimportant is a mistake. "The central banks, the ones that print all the money, are buying the most gold," he said. "That's the smart money. Institutions and hedge funds are not so smart. They're included with everyone else, and they're running after Bitcoin. They're running after stocks."

What's next for Bitcoin

Soloway describes the recent Bitcoin rally as a "culmination of greed," with people chasing the market, which creates a highly volatile environment.

"Just looking at the last week, we're up from $50,000. The momentum of that carried up to this all-time high, but it's also known as a technical double top," he described. "There's notoriously going to be players that are selling into that level or shorting it. And when you get to this point of euphoria, it gets every last buyer in so that when those sellers and shorters start pounding it down, there's no one left to buy."

For Soloway's breakdown of Bitcoin's immediate support and resistance levels, watch the video above.

Soloway warns that if the stock market tops out and sells off, Bitcoin is at risk of following in its footsteps. "This has been my thesis for a long time — if the stock market sells off dramatically, Bitcoin comes in dramatic as well," he said.

In risk-off trading conditions, Bitcoin retraces back. For Soloway's price forecast in this scenario, watch the video above.

For insights on how steep the market selloff could be and the immediate triggers for the price reversal, watch the video above.

Soloway also reveals where he sees Bitcoin in May and at the year-end. For his longer-term price calls, watch the video above.

What's next for gold

This gold breakout, which has been long coming, is just the start for gold and gold miners, Soloway noted.

"This is huge for gold. We've been hovering right up against this level since the 2020 COVID run," he said. "You can calculate the next target via an inverse head and shoulders, and it gives us a $2,500 an ounce."

On when gold can hit this price target, watch the video above.

Soloway also breaks down the contradiction between gold reaching new all-time highs and gold ETFs continuing to see outflows.

"Gold has stayed so close to its all-time highs because there is demand. There's massive demand from governments stockpiling. It has to do with the debasement of currencies. These central banks know that they will have to, at some point, turn the printing presses on. How do you backstop your own? You have to buy that gold," he said.

For other assets, Soloway is bullish on going into the spring and summer, watch the video above.

Kitco Media

Anna Golubova

Time to Buy Gold and Silver

David

Gold’s shock rally has analysts grasping for explanations

Gold’s shock rally has analysts grasping for explanations

Gold’s surprising rally to new all-time highs has even seasoned industry professionals scratching their heads as to the true cause.

“It is clear that despite the West's disaffection for gold […] demand in China is more than offsetting the shortfall, with monumental volumes flowing from West to the East,” wrote Metals Daily CEO Ross Norman in a LinkedIn post. “As such, this rally seems to have caught Western experts and forecasters by surprise – a stealth rally if you like – which suggests to me the buying is beyond the immediate purview of most of us.”

Norman said the “conventional explanation” is that gold is rallying ahead of an expected rate cut at the June Fed meeting, which would weaken the dollar and strengthen gold, “but the dollar is actually up YTD and silver is not validating the move higher in the complex as evidenced by a decline in the gold/silver ratio as we would have expected.”

Another possible explanation would be the decline in U.S. treasury yields, “down 1.2% in the last month and with gold up nearly 6% … but again no evidence that institutions are behind this as ETF demand remains lacklustre.”

Norman said that there’s no doubt that short covering in the futures market has helped boost the rally, but the move is too big for that to be the main driver, “so something else is at play.”

“A significant part of the answer is of course Chinese buying and not just the traditional 'dama' or Chinese grandmothers – Gen Z investors have joined the fray,” he wrote. “But Chinese premiums are slipping (down from a strong $45 premium to $38) as have Indian premiums (down from $5 discount to a $16 discount) suggesting Asia is behaving in a moderately price-elastic manner and easing back on purchases in the face of price strength.”

Norman said he believes the shock rally is being driven by central bank buying, which continues to be very strong according to the latest January numbers.

“With the US moving beyond simple sanctions and threatening to sequester $300 billion in Russian financial assets (to be sold and paid across to support Ukraine) … some Central Banks … even the non-aligned ones, will be alarmed for fear that they might be in the firing line themselves at some point potentially,” he wrote. “It follows therefore that they might prudently wish to diversify into non-dollar assets.”

James Steel, an analyst at HSBC Holdings PLC, told Bloomberg in a report that the scale of the move is surprising given that there hasn’t been a significant change in rate cut expectations or another clear macroeconomic driver.

“The velocity and the speed were very sudden, very fast,” Steel said. “It didn’t seem to have a smoking gun.”

Ole Hansen, commodity strategist at Saxo Bank, said that the ISM manufacturing PMI data for February released on March 1, which came in well below expectations, highlighted the rising risk of a stock market correction, and may have prompted some investors to move from equities to gold.

TD Securities commodity strategist Ryan McKay believes that macro funds and momentum buying by commodity trading advisors contributed to gold’s sudden gains, with the latest Commodity Futures Trading Commission data showing hedge funds and money managers increasing their net bullish gold bets as of Feb. 27. Still, McKay noted that these investors added short positions roughly in line with new longs, meaning they’re not all in on gold’s upward move either.

The report noted that gold’s recent rally has also highlighted the growing disconnect between spot prices and gold-backed ETF outflows. “Holdings in SPDR Gold Shares, the world’s largest such ETF, fell by 0.3 per cent on March 4, taking the total to the lowest level since July 2019, according to data compiled by Bloomberg,” they wrote. “Those outflows have partly been offset by persistent central bank demand for the precious metal, which helped keep prices elevated even as real interest rates spiked last year.”

They also pointed out that physical demand for gold bars and coins also absorbed the gold that was sold by ETFs, and a strong Lunar New Year saw Chinese consumers buying gold as a hedge against the country’s beleaguered stock markets and real estate sector.

Ewa Manthey, commodities strategist at ING, believes the rally is being driven by a combination of rate cut expectations and geopolitical turmoil. “Speculation over a Fed rates pivot and continued geopolitical tensions keep gold shining,” said Manthey. “We expect gold prices to trade higher this year as safe-haven demand continues to be supportive amid geopolitical uncertainty with ongoing wars and the upcoming U.S. election.”

Spot gold hit a high of $2,150 per ounce around noon EST as Fed Chair Jerome Powell presented the central bank’s semiannual Monetary Policy Report to the U.S. House Financial Services Committee. It last traded at $2,148.90, up 0.84% on the day at the time of writing.

Kitco Media

Ernest Hoffman

Time to Buy Gold and Silver

David

Gold continues to rise, but technical studies suggest gold is overbought

Gold continues to rise, but technical studies suggest gold is overbought

Gold continues its dynamic rally moving to higher ground for the fourth consecutive day, with the last three consecutive days resulting in a new record settlement price. As of 4:00 PM ET, gold futures basis the most active April contract is currently trading up $11.70 and fixed at $2138.20. However, today gold futures are trading well off of $2150.50 its intraday high, the first occasion in the last few days in which gold has not closed near or at its daily high.

The current rally became dynamically stronger last Friday, March 1st when gold futures opened just at its 50-day simple moving average and gained $41 in trading. The $41 gain occurred after a report by the Institute for Supply Management which revealed its manufacturing index dropped to 47.8 in February, “signifying an economic contraction.” This is according to Ryan McIntyre, managing partner at Sprott Asset Management.

Follow-through buying was evident yesterday with gold futures scoring over a $30 gain taking the precious yellow metal to $2126.30.

However, this latest rally is not broad-based but rather fueled by a “jump in speculative betting”, according to Adrian Ash, director of research at BullionVault. Speaking to MarketWatch he said there is “no gold rush among Western investors right now, not in physical bullion and not outside Comex futures and options.”

Ash added that “gold exchange-traded funds continue to “shrink to pre-pandemic size; coin shops are slashing their premiums and buy-back prices to try clearing the flood of customer selling.”

The current rally is fueled largely by overwhelming optimism that the Federal Reserve will begin its pivot from interest rate hikes to its first interest rate cut since March 2022. However, this optimism is not in-line with recent comments of multiple Federal Reserve members including Chairman Powell. Fed officials continue to express the narrative that “they are in no rush to cut rates”.

Investors are hoping to gain more insight when Chairman Powell heads to Capitol Hill for his semi-annual testimony to the House and Senate beginning tomorrow. According to the CME’s FedWatch tool, there is a 97% probability that the Federal Reserve will not begin to cut rates at their March FOMC meeting and a 79.1% probability that the Fed’s benchmark Fed funds rate will remain unchanged at the May meeting.

However, this probability indicator dramatically favors a rate cut by June with only a 27.2% probability that they will not cut rates in June.

That being said, there are technical indicators that suggest that the recent rise in gold prices has put the precious yellow metal in an overbought situation. The chart above is a daily Japanese candlestick chart of gold with a stochastic oscillator. This study indicates that gold is very much overbought well over 80%, with the %K line crossing below the %D line which signals a strong potential for gold prices to decline. According to Investopedia, “ Stochastic oscillator charting generally consists of two lines: one reflecting the actual value of the oscillator for each session, and one reflecting its three-day simple moving average. Because price is thought to follow momentum, the intersection of these two lines is considered to be a signal that a reversal may be in the works, as it indicates a large shift in momentum from day to day.”

The chart above is also a daily Japanese candlestick chart with the RSI (Relative Strength Index) at 76.23. The RSI is a momentum indicator that measures the speed and magnitude of recent price changes used to evaluate if the market is over or undervalued. The RSI has moved above 70 indicating that gold is overbought and also suggests that gold could be primed for a trend reversal or a technical price pullback according to Investopedia.

While both of these technical studies strongly indicate that gold is overbought, the caveat to these momentum indicators is that gold could continue to rise and continue to be overbought. However, the fact that both of these indicators suggest that gold is extremely overbought warrants our attention as a potential indication that gold could pivot from its current bullish demeanor and signal imminent price correction.

Wishing you as always good trading,

Kitco Media

Gary Wagner

Time to Buy Gold and Silver

David

Gold price above $2,100, the market is just getting started – Jess Felder

Gold price above $2,100, the market is just getting started – Jess Felder

The gold market is seeing solid follow-through buying activity following last week’s record closing price. The precious metal has pushed above $2,100 an ounce, and according to one market analyst, it has room to run.

In an interview with Kitco News, Jess Felder, founder of the Felder Report, said he has been looking for gold to break to the upside as the price action has generated some very bullish technical patterns.

“Gold is forming consistent bullish flag patterns. The price spikes higher, consolidates for a period and then we see another price spike higher. Gold has been looking to break higher for a while now. From a purely technical standpoint, it looks to me like there's a projected target of a couple hundred dollars higher for gold in the short term, but longer term, we're looking at $2,700, $2800, perhaps over the next year or two. Technically, gold just looks very, very good.”


Along with gold’s technical outlook, Felder said that the precious metal has a robust fundamental outlook as he does not expect the Federal Reserve will be able to bring inflation down to its 2% target.

He added that persistently higher inflation could cause investors to lose faith in the U.S. central bank, weakening the U.S. dollar and making gold an attractive asset. At the same time, Fleder said that a weakening economy will force the Federal Reserve to at least reintroduce quantitative easing as it maintains its restrictive monetary policy.

“If you had both of those things at the same time, that would be the ultimate bull case for gold,” he said. “If it turns out the Fed hasn't done enough to sustainably bring inflation back down, that's going to worry people that way. The whole soft landing narrative is based on the idea that inflation comes down so the Fed can lower rates without a recession. But if inflation doesn't come down and they can't lower rates, that will impact the economy.”

At the same time, Felder noted that credit conditions within global financial markets continue to deteriorate. He added that sooner or later, the Federal Reserve is going to have to pump more liquidity into the market.

As good as gold looks, miners look even better

It’s not just the precious metal that looks good. Felder said that he is extremely bullish on precious metals miners as this sector hasn’t been this beat up since the bear market lows in 2015

However, Felder pointed out that the negative sentiment is not aligned with the sector’s solid fundamentals

“To me, this is a very powerful sentiment signal; it suggests that this is about as bearish as investors can get,” he said. “It’s the ultimate irony: miners are trading as if gold is in a major bear market, but gold is holding near record highs.”

As to what will entice investors back into the mining space, Felder said that he expects a rally in gold to create a lot of new interest. At the same time, he said that a correction in the broader equity market could push some funds into miners.

“There are interesting dynamics in the markets right now. Investors are avoiding commodities, generally, because they're worried that if a recession hits, demand for commodities is going to tank. However, they're obviously not avoiding equities. Personally, I would be more worried about equities because corporate profits in a recession fall a lot faster than demand for commodities.”

As to where he sees value in the sector, Felder said that with higher gold prices, major producers like Barrick, Newmont, and Agnico Eagle will benefit from increased cash flows. He added that these companies also represent less risks for generalist investors.

Newmont, the world’s largest gold producer, has recently attracted particular attention after its share price dropped to a five-year low. The company’s share price has since bounced off those lows, currently trading at $32.91 per share.

“Senior producers are about as dirt cheap as they can get,” he said.


Kitco Media

Neils Christensen

Time to Buy Gold and Silver

David

Gold bears are hibernating this week as the market sees record closing price

Gold bears are hibernating this week as the market sees record closing price

A record weekly close for gold is fueling significant bullish sentiment in the marketplace; however, some analysts have said that this breakout still needs to be tested, and investors should be careful about chasing prices.

Results of the Kitco News Weekly Gold Survey show that both Wall Street analysts and retail investors are cautiously optimistic about gold next week.

Gold prices managed to push above $2,050 an ounce Thursday after The Federal Reserve’s preferred inflation gauge showed a benign rise in consumer prices. After a slow start Friday, the precious metal started to attract some followthrough buying momentum following weaker-than-expected manufacturing and sentiment data.

April gold futures last traded at $2,095.20 an ounce, up 2% from last week. The precious metal’s best performance since late November has created a new record closing price.

While the rally has breathed new life into the precious metals market, some analysts have said that the price action remains sensitive as profit-taking and volatility could push prices back to within their well-defined channel.

Adam Button, chief currency strategist at Forexlive.com, said that Friday’s rally shows how much potential gold has; however, he added that he doesn’t see the rally as being backed by strong fundamentals.

“I just don’t see how a miss in ISM manufacturing could drive prices this high. I would be more convinced this rally was sustainable if it came after really disappointing employment numbers,” he said. “I think investors do need to pay attention because this shows how many investors are waiting for the dollar to crack before jumping into the market.”

James Stanley, senior market strategist at Forex.com, said that he is also not chasing the market, even as he anticipates higher prices in the near-term.

“I don’t think the pivot at the Fed is here yet. And while I have been very bullish on gold the past few weeks, even after the 2k test, spot [prices] trading over $2,075 is something I don’t want to chase here. That was the level that caught the high in 2020 and has remained a significant roadblock for bulls in the three and a half years since,” he said. “The NFP report is going to be a big deal for macro next week, but that’s not until Friday, so there could be some testing around $2100, but I’m not optimistic enough on drive beyond that level to chase the move while near that long-term resistance.”

This week, 14 analysts participated in the Kitco News Gold Survey and not one is bearish on gold in the near term. The survey showed 11 analysts, or 79%, were bullish on gold. At the same time, three analysts, or 21%, were neutral on the precious metal.

Meanwhile, Main Street investor sentiment continues to improve steadily. This week, 175 votes were cast in Kitco’s online survey. In a slight improvement from last week, 77 retail investors,representing 44%, looked for gold to rise next week. Another 43, or 25%, predicted it would be lower, while 55 respondents, or 31%, were neutral on the near-term prospects for the precious metal.

Marc Chandler, Managing Director at Bannockburn Global Forex, said $2,088 could represent a major resistance point for gold next week.

“Beyond that is the record high set on that spike in early December to $2135.60. I think we will see a need for the dollar’s resilience to buckle, and that may take greater confidence in a near-term Fed cut. Some Wall Street economists have begun giving up on a cut, and former Treasury Secretary Summers has cautioned that the next move may still be a hike,” he said.

Phillip Strieble, chief market strategist at Blue Line Futures, said that while gold’s rally is impressive, he would like to see gold hold higher support to confirm that this isn’t another bull trap.

Some analysts have said that while gold is seeing an impressive rally, it faces significant resistance at $2,100 an ounce.

Sean Lusk, co-director of commercial hedging at Walsh Trading, said that he sees potential for gold to go higher but remains hesitant to chase the market.

“We have been consolidating for a while now, so this could have some teeth to it,” he said.

Lusk added that investors could look at options to get some exposure to gold and take advantage of the market's momentum. He added that a medium-term play would be to buy $2,100 August gold calls and sell $2,275 February gold puts.

“A modest 5% rally takes the market to $2,175,” he said. “Should August 2100 call trade $70 in the money, we could collect $5K to $6K per spread upon exit, in my opinion.”

Kitco Media

Neils Christensen

Time to Buy Gold and Silver

David